File:Old-age support ratio in OECD.svg
Jump to navigation
Jump to search

Size of this PNG preview of this SVG file: 800 × 333 pixels. Other resolutions: 320 × 133 pixels | 640 × 267 pixels | 1,024 × 427 pixels | 1,280 × 533 pixels | 2,560 × 1,067 pixels | 1,080 × 450 pixels.
Original file (SVG file, nominally 1,080 × 450 pixels, file size: 133 KB)
Captions
Captions
Add a one-line explanation of what this file represents

|
This file may be updated to reflect new information. If you wish to use a specific version of the file without new updates being mirrored, please upload the required version as a separate file. |
Summary[edit]
| Description |
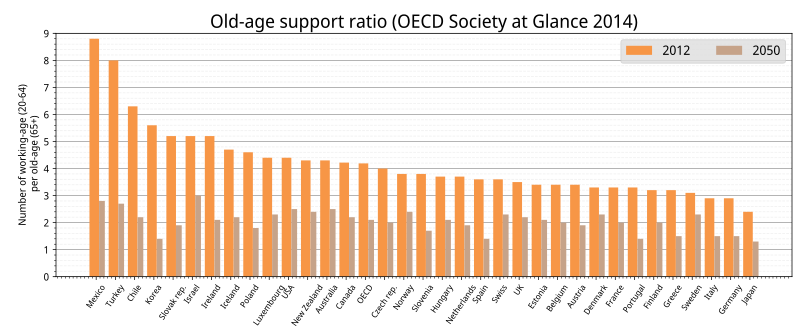
English: The old-age support ratio |
| Date | |
| Source |
Own work, Data from OECD Society at a glance 2014 https://doi.org/10.1787/soc_glance-2014-en |
| Author | Yuasan |
| Permission (Reusing this file) |
CC-0 |
Licensing[edit]
I, the copyright holder of this work, hereby publish it under the following license:
| This file is made available under the Creative Commons CC0 1.0 Universal Public Domain Dedication. | |
| The person who associated a work with this deed has dedicated the work to the public domain by waiving all of their rights to the work worldwide under copyright law, including all related and neighboring rights, to the extent allowed by law. You can copy, modify, distribute and perform the work, even for commercial purposes, all without asking permission.
|
graph data[edit]
import matplotlib.pyplot as plt
import pandas as pd
import numpy as np

df = pd.read_csv("data.tsv", index_col=0 , sep = "\t")

fig, ax = plt.subplots(figsize=(12, 5))
x = np.arange(df.index.size)
ax.bar(x-0.1, df["2012"] , color="#F79646", width=0.5, bottom=0)
ax.bar(x+0.3, df["2050"] , color="#C6A389", width=0.3, bottom=0)

ax.legend(df.columns, fontsize=14, ncol=2, loc='upper right',  frameon=True, facecolor="#dddddd")
ax.set_axisbelow(True)

plt.rcParams['font.family'] = 'sans-serif'
plt.rcParams['font.sans-serif'] = ['Noto Sans Display']
plt.subplots_adjust(left=0.07, bottom=0.17, right=0.99, top=0.9)

plt.title("Old-age support ratio (OECD Society at Glance 2014)", fontsize=20)
plt.tick_params(labelsize=10, pad=4)
plt.xticks(x, df.index, rotation=55, size=9)

plt.ylabel("Number of working-age (20-64)\n per old-age (65+)", size=11)
plt.yticks(fontsize=11)
plt.ylim([0,9])

ax.minorticks_on()
plt.grid(which='major',color='#999999',linestyle='-', axis="y")
plt.grid(which='minor',color='#eeeeee',linestyle='--', axis="y")

plt.savefig("image.svg")
File history
Click on a date/time to view the file as it appeared at that time.
| Date/Time | Thumbnail | Dimensions | User | Comment | |
|---|---|---|---|---|---|
| current | 08:46, 3 January 2023 | | 1,080 × 450 (133 KB) | Yuasan (talk | contribs) | fix |
| 06:38, 27 October 2014 |  | 758 × 387 (82 KB) | Yuasan (talk | contribs) | fix | |
| 05:53, 27 October 2014 |  | 758 × 387 (85 KB) | Yuasan (talk | contribs) | User created page with UploadWizard |
You cannot overwrite this file.
File usage on Commons
The following page uses this file:
- File:Oecd-oldage supportratio.svg (file redirect)
File usage on other wikis
The following other wikis use this file: