File:Normal distribution.svg
Jump to navigation
Jump to search

Size of this PNG preview of this SVG file: 480 × 180 pixels. Other resolutions: 320 × 120 pixels | 640 × 240 pixels | 1,024 × 384 pixels | 1,280 × 480 pixels | 2,560 × 960 pixels.
Original file (SVG file, nominally 480 × 180 pixels, file size: 12 KB)
Captions
Captions
Add a one-line explanation of what this file represents
Summary[edit]
| Description |
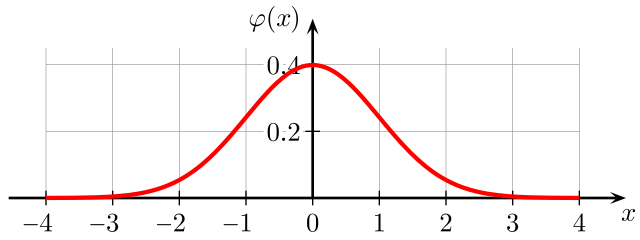
English: Plot of the Normal distribution (gaussian function) Accurate red plotcurve. Labels are embedded in Computer-Modern font. |
| Date | |
| Source | Own work |
| Author | Geek3 |
| SVG development |


| Description | Plot of the normal distribution |
|---|---|
| Equation | |
| Coordinate System | Cartesian |
| X Range | -4 .. 4 |
| Y Range | 0 .. 0.4 |
| Accuaracy | 0.000001 units |
See also[edit]
Licensing[edit]
I, the copyright holder of this work, hereby publish it under the following licenses:

|
Permission is granted to copy, distribute and/or modify this document under the terms of the GNU Free Documentation License, Version 1.2 or any later version published by the Free Software Foundation; with no Invariant Sections, no Front-Cover Texts, and no Back-Cover Texts. A copy of the license is included in the section entitled GNU Free Documentation License. |
This file is licensed under the Creative Commons Attribution 3.0 Unported license.
- You are free:
- to share – to copy, distribute and transmit the work
- to remix – to adapt the work
- Under the following conditions:
- attribution – You must give appropriate credit, provide a link to the license, and indicate if changes were made. You may do so in any reasonable manner, but not in any way that suggests the licensor endorses you or your use.
You may select the license of your choice.
File history
Click on a date/time to view the file as it appeared at that time.
| Date/Time | Thumbnail | Dimensions | User | Comment | |
|---|---|---|---|---|---|
| current | 18:11, 13 March 2010 | 480 × 180 (12 KB) | Geek3 (talk | contribs) | less gridlines | |
| 17:27, 13 March 2010 | 480 × 180 (13 KB) | Geek3 (talk | contribs) | {{Information |Description={{en|1=normal distribution}} |Source={{own}} |Author=Geek3 |Date=2010 |Permission= |other_versions= }} Category:Normal distribution |
You cannot overwrite this file.
File usage on Commons
The following page uses this file:
File usage on other wikis
The following other wikis use this file:
- Usage on de.wikipedia.org
- Usage on de.wikiversity.org
- Kurs:Mathematik (Osnabrück 2009-2011)/Teil II/Vorlesung 36
- Kurs:Mathematik für Anwender (Osnabrück 2011-2012)/Teil I/Vorlesung 27
- Kurs:Analysis (Osnabrück 2013-2015)/Teil II/Vorlesung 31
- Kurs:Analysis (Osnabrück 2014-2016)/Teil II/Vorlesung 31
- Kurs:Analysis (Osnabrück 2014-2016)/Teil II/Vorlesung 31/kontrolle
- Kurs:Analysis (Osnabrück 2021-2023)/Teil II/Vorlesung 31
- Kurs:Analysis (Osnabrück 2021-2023)/Teil II/Vorlesung 31/kontrolle
- Uneigentliche Integrale/Einführung/Textabschnitt
- Kurs:Analysis (Osnabrück 2013-2015)/Teil II/Vorlesung 31/kontrolle
- Kurs:Mathematik für Anwender (Osnabrück 2011-2012)/Teil I/Vorlesung 27/kontrolle
- Kurs:Mathematik (Osnabrück 2009-2011)/Teil II/Vorlesung 36/kontrolle
- Usage on ja.wikibooks.org
- Usage on pl.wikipedia.org
- Usage on sv.wikibooks.org