File:NAcc.svg
Jump to navigation
Jump to search

Size of this PNG preview of this SVG file: 800 × 404 pixels. Other resolutions: 320 × 162 pixels | 640 × 323 pixels | 1,024 × 517 pixels | 1,280 × 646 pixels | 2,560 × 1,293 pixels | 1,600 × 808 pixels.
Original file (SVG file, nominally 1,600 × 808 pixels, file size: 25 KB)
Captions
Captions
Add a one-line explanation of what this file represents
Summary[edit]
| Description |
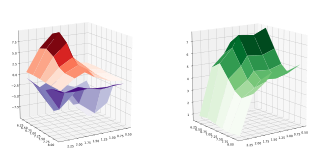
English: Ventral-Dorsal coordinates lie along the X axis (6.25-8), while Rostral-Caudal coordinates lie along the Y axis(0.5-2.5). The z axis represents the t value from the data scraped from images provided by Pecina and Berridge 2005. The graph on the left represents enhanced liking(Red) and reduced Disgust(Purple), while the right graph represents enhanced liking. |
| Date | |
| Source | Own work |
| Author | Petergstrom |
| SVG development | This diagram was created with Matplotlib. This diagram was extracted with Inkscape. |
Licensing[edit]
Petergstrom, the copyright holder of this work, hereby publishes it under the following license:
This file is licensed under the Creative Commons Attribution-Share Alike 4.0 International license.
Attribution: Petergstrom
- You are free:
- to share – to copy, distribute and transmit the work
- to remix – to adapt the work
- Under the following conditions:
- attribution – You must give appropriate credit, provide a link to the license, and indicate if changes were made. You may do so in any reasonable manner, but not in any way that suggests the licensor endorses you or your use.
- share alike – If you remix, transform, or build upon the material, you must distribute your contributions under the same or compatible license as the original.
File history
Click on a date/time to view the file as it appeared at that time.
| Date/Time | Thumbnail | Dimensions | User | Comment | |
|---|---|---|---|---|---|
| current | 12:02, 5 June 2018 | | 1,600 × 808 (25 KB) | Ras67 (talk | contribs) | {{Information |description={{en|1=Ventral-Dorsal coordinates lie along the X axis (6.25-8), while Rostral-Caudal coordinates lie along the Y axis(0.5-2.5). The z axis represents the t value from the data scraped from images provided by Pecina and Berridge 2005. The graph on the left represents enhanced liking(Red) and reduced Disgust(Purple), while the right graph represents enhanced liking.}} |date=2018-06-01 |source={{own}} |author=Petergstrom |other fields={{Igen|Mat... |
You cannot overwrite this file.
File usage on Commons
The following page uses this file:
File usage on other wikis
The following other wikis use this file:
- Usage on en.wikipedia.org