File:Metoda syntetycznej kontroli PL.svg

Original file (SVG file, nominally 563 × 563 pixels, file size: 42 KB)
Captions
Captions
Summary[edit]
| DescriptionMetoda syntetycznej kontroli PL.svg |
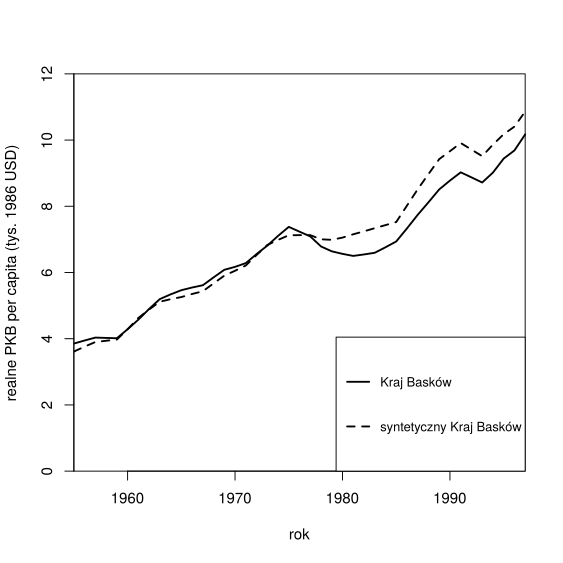
English: Graph from CC-BY-3.0/GPL paper doi:10.18637/jss.v042.i13 showing an example of synthetic control method use, based on Abadie et al. analysis of Basque Country GDP |
| Date | |
| Source |
Reproduced in R based on the code presented in the CC-BY-3.0 and GPL licensed open science paper: Abadie, Alberto and Diamond, Alexis J. and Hainmueller, Jens, Synth: An R Package for Synthetic Control Methods in Comparative Case Studies (June 2011). Journal of Statistical Software, Vol. 42, Issue 13, June 2011. Paper and license information available at: https://www.jstatsoft.org/article/view/v042i13
|
| Author | Alberto Abadie, Alexis J. Diamond, Jens Hainmueller |
Licensing[edit]
- You are free:
- to share – to copy, distribute and transmit the work
- to remix – to adapt the work
- Under the following conditions:
- attribution – You must give appropriate credit, provide a link to the license, and indicate if changes were made. You may do so in any reasonable manner, but not in any way that suggests the licensor endorses you or your use.
File history
Click on a date/time to view the file as it appeared at that time.
| Date/Time | Thumbnail | Dimensions | User | Comment | |
|---|---|---|---|---|---|
| current | 17:32, 24 March 2019 |  | 563 × 563 (42 KB) | Jaszczuroczłek (talk | contribs) | User created page with UploadWizard |
You cannot overwrite this file.
File usage on Commons
There are no pages that use this file.
File usage on other wikis
The following other wikis use this file:
- Usage on pl.wikipedia.org
Metadata
This file contains additional information such as Exif metadata which may have been added by the digital camera, scanner, or software program used to create or digitize it. If the file has been modified from its original state, some details such as the timestamp may not fully reflect those of the original file. The timestamp is only as accurate as the clock in the camera, and it may be completely wrong.
| Width | 450pt |
|---|---|
| Height | 450pt |