File:Kombinierter Verkehr Eisenbahn Entwicklung.svg
Jump to navigation
Jump to search

Size of this PNG preview of this SVG file: 800 × 600 pixels. Other resolutions: 320 × 240 pixels | 640 × 480 pixels | 1,024 × 768 pixels | 1,280 × 960 pixels | 2,560 × 1,920 pixels.
Original file (SVG file, nominally 800 × 600 pixels, file size: 32 KB)
Captions
Captions
Add a one-line explanation of what this file represents
Summary[edit]
| Description |
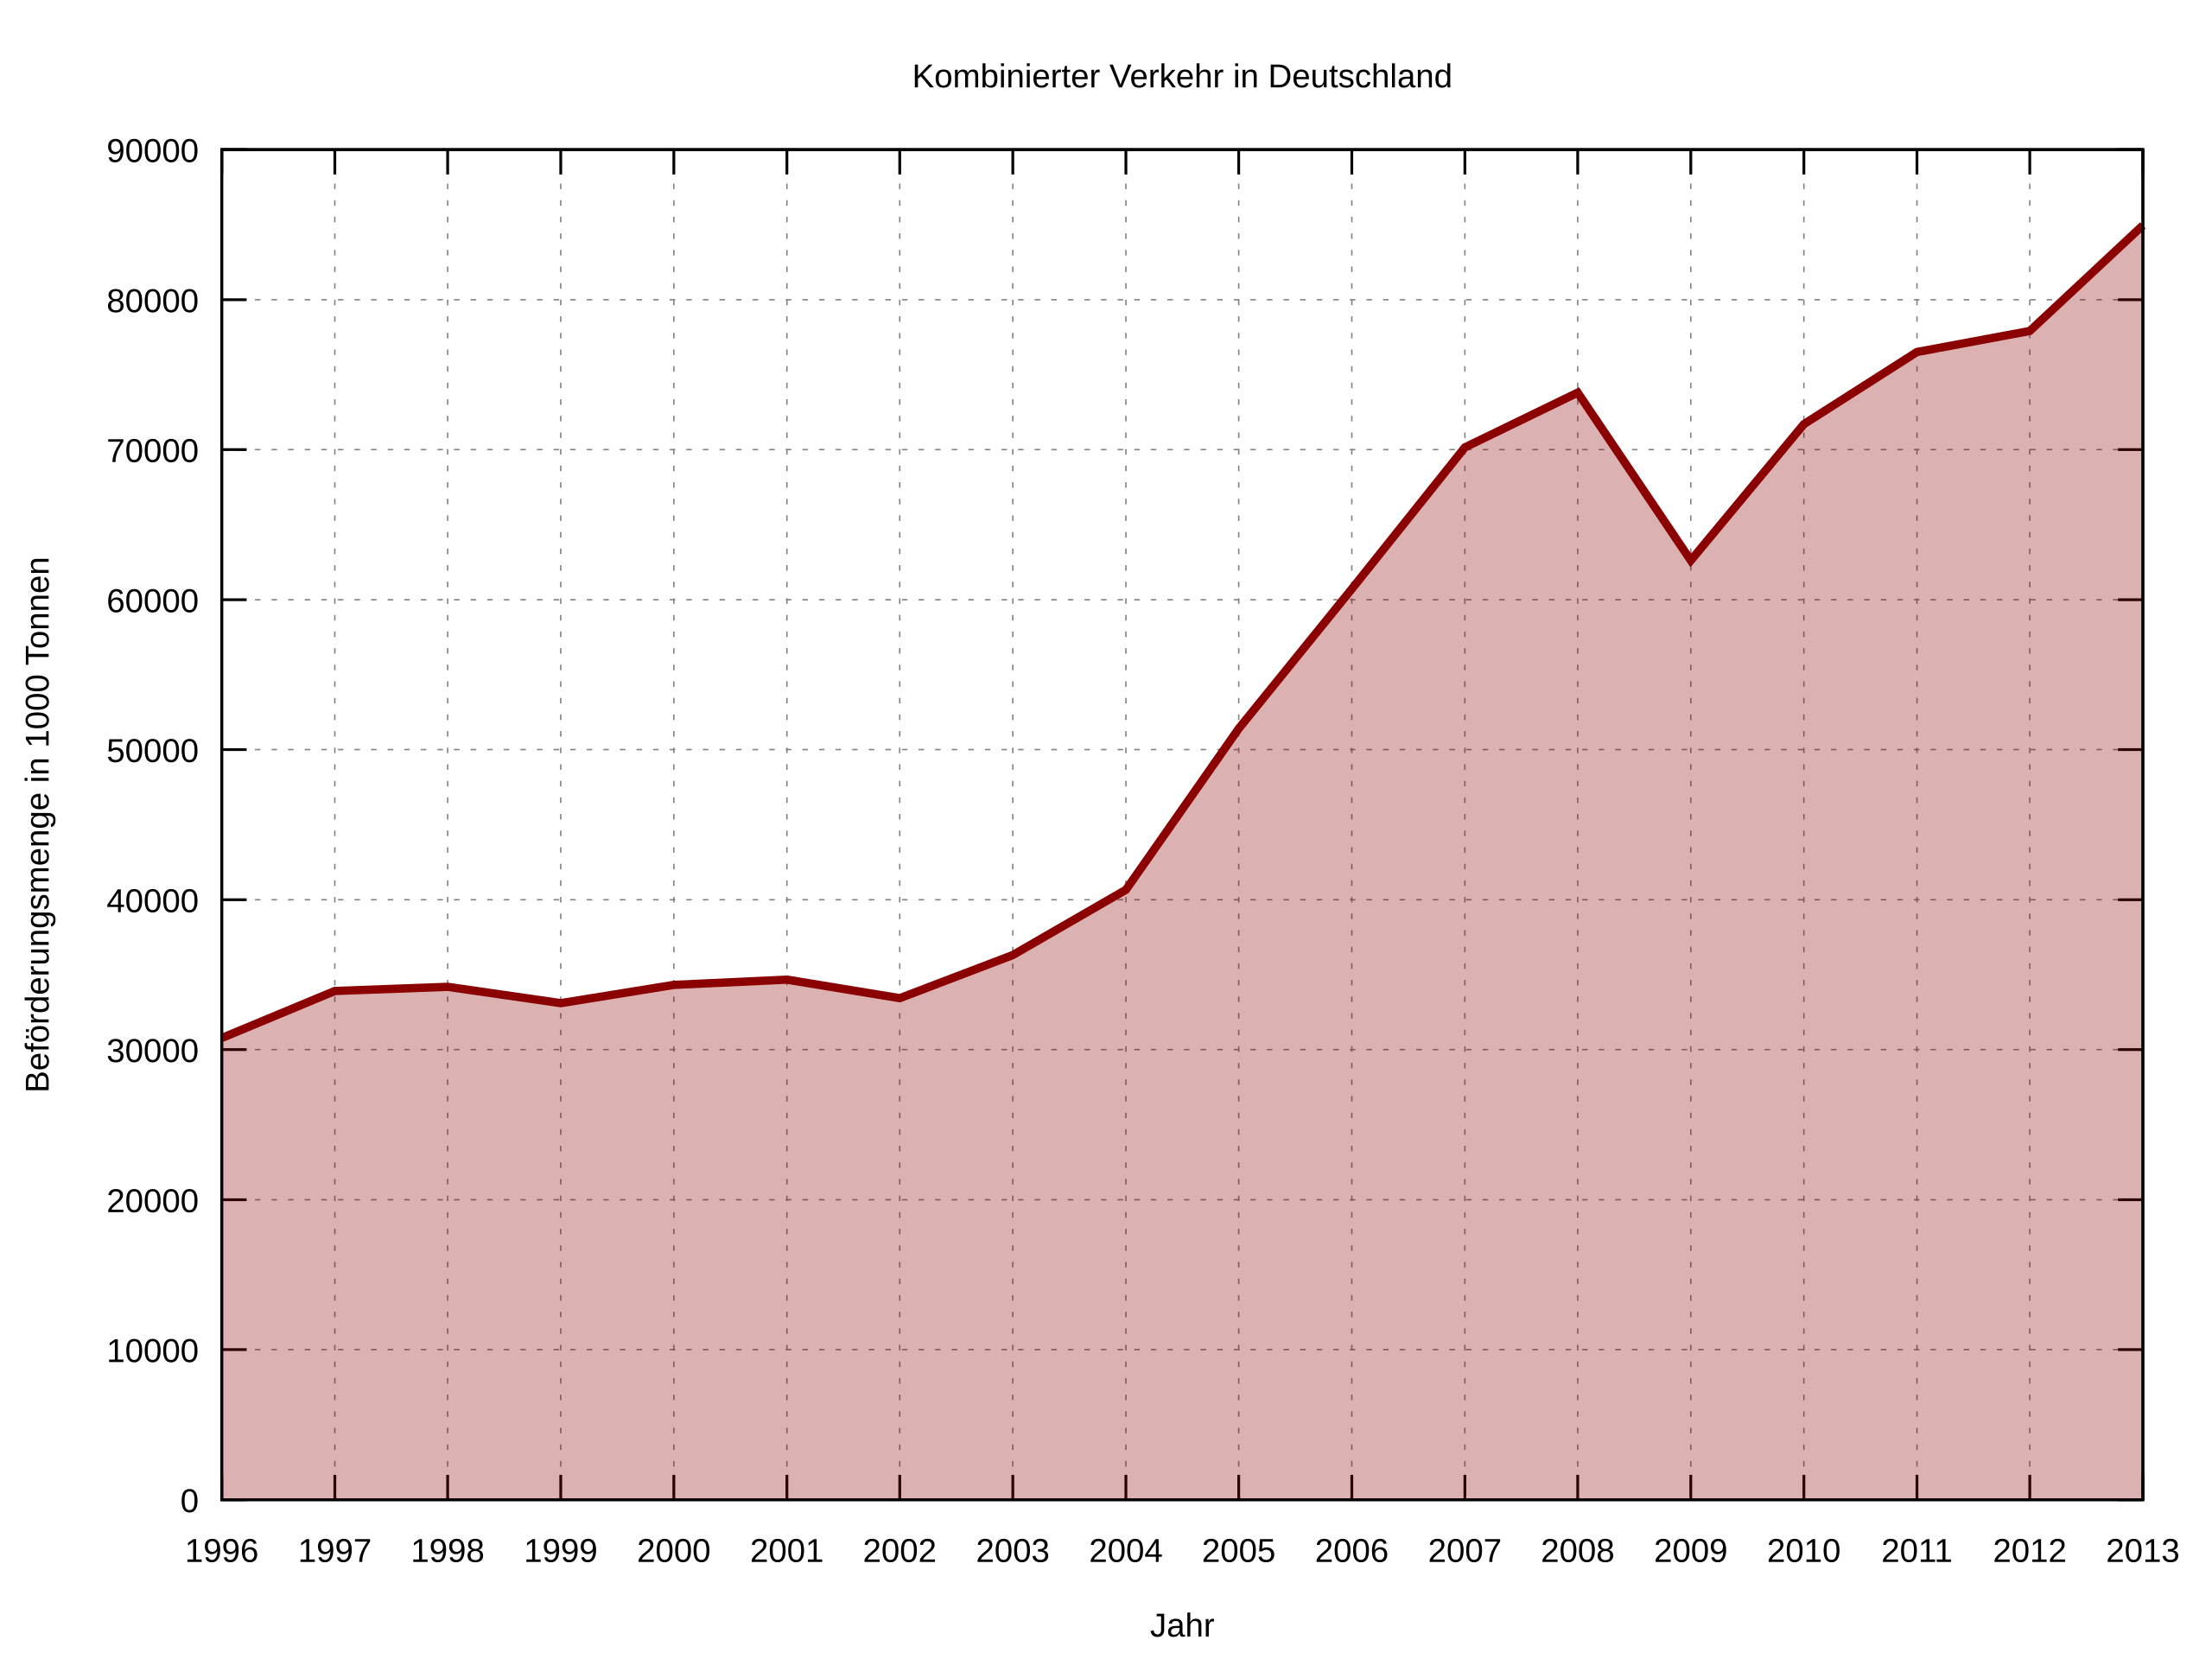
Deutsch: Beförderungsmenge im Kombinierten Verkehr von 1996 bis 2011. Betrachtet wird die Gesamtmasse der auf dem Schienenweg transportierten Güter, die im Vor- oder Nachlauf mit anderen Verkehrsmitteln transportiert wurden. |
| Date | |
| Source |
Daten: Bundesministerium für Verkehr, Bau und Stadtentwicklung (Hrsg.): Verkehr in Zahlen 2013/2014. DVV Media Group, Hamburg 2013, ISBN 978-3-87154-493-4, S. 274. Grafik: Own work |
| Author | EveryPicture; Teile des Quelltexts: Simified |
| SVG development | This plot was created with Gnuplot. This plot uses embedded text that can be easily translated using a text editor. |
Licensing[edit]
I, the copyright holder of this work, hereby publish it under the following license:
This file is licensed under the Creative Commons Attribution-Share Alike 3.0 Unported license.
- You are free:
- to share – to copy, distribute and transmit the work
- to remix – to adapt the work
- Under the following conditions:
- attribution – You must give appropriate credit, provide a link to the license, and indicate if changes were made. You may do so in any reasonable manner, but not in any way that suggests the licensor endorses you or your use.
- share alike – If you remix, transform, or build upon the material, you must distribute your contributions under the same or compatible license as the original.
Gnuplot script to generate this plot[edit]
Source code
Gnuplot code
# Erstellt von EveryPicture mit Gnuplot Online, http://gnuplot.respawned.com/
# Lizenz: CC-BY-SA 3.0 unported, https://creativecommons.org/licenses/by-sa/3.0/deed.de
# Basierend auf http://commons.wikimedia.org/wiki/File:Bayreuth_Bevoelkerungsentwicklung.svg von Michael Fiedler <michael.fiedler87@gmx.de>

set title 'Kombinierter Verkehr in Deutschland'
unset key
set style fill transparent solid 0.3
set grid xtics ytics mytics

set xlabel 'Jahr'
# Definitionsbereich
set xrange [1996:2011]
# Einteilung der x-Achse
set xtics 1

set ylabel 'Beförderungsmenge in 1000 Tonnen'
# Wertebereich
set yrange [0:90000]
# Einteilung der y-Achse
set ytics 10000
set format y '%.0f'

set terminal svg size 800,600 font 'Arial,10'
set output 'Ausgabedatei.svg'
Data
# '-' nimmt die nachfolgenden Daten als Eingabewerte
plot '-' using 1:2 with filledcurves below x1 linetype rgb 'dark-red' linewidth 3,

# Datenquelle: Bundesministerium für Verkehr, Bau und Stadtentwicklung (Hrsg.): Verkehr in Zahlen 2013/2014.
1996 30783
1997 33918
1998 34190
1999 33102
2000 34320
2001 34664
2002 33429
2003 36313
2004 40655
2005 51411
2006 60706
2007 70147
2008 73808
2009 62606
2010 71694
2011 76508
e
File history
Click on a date/time to view the file as it appeared at that time.
| Date/Time | Thumbnail | Dimensions | User | Comment | |
|---|---|---|---|---|---|
| current | 10:10, 21 June 2015 | | 800 × 600 (32 KB) | Kopiersperre (talk | contribs) | Verkehr in Zahlen 2014/2015 |
| 22:25, 22 January 2015 |  | 800 × 600 (19 KB) | EveryPicture (talk | contribs) |
You cannot overwrite this file.
File usage on Commons
The following 4 pages use this file: