File:Kirkwood-gaps-as-disk.png
Jump to navigation
Jump to search

Size of this preview: 640 × 600 pixels. Other resolutions: 256 × 240 pixels | 819 × 768 pixels | 1,092 × 1,024 pixels | 2,185 × 2,048 pixels | 2,560 × 2,400 pixels.
Original file (2,560 × 2,400 pixels, file size: 109 KB, MIME type: image/png)
Captions
Captions
Add a one-line explanation of what this file represents
| Description |
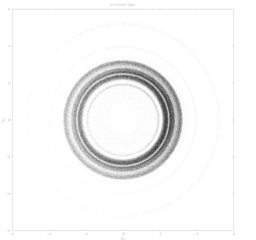
English: This is a plot of a*cos(node + peri), a*sin(node + peri) for the Minor Planet Centre's MPCORB.DAT table of asteroid elements as of 2006-03-30. It is a re-creation of fig 9.27 in Murray and Dermott's Solar System Dynamics, p. 456.
It is not a plot of individual asteroid positions, but a rendering of quantities derived from the osculating elements in the aforementioned table. The famous Kirkwood Gaps are clearly visible, as is a clear bias towards the longitude of Jupiter's perihelion (which points to the right and a bit up in this view). Please click on the full resolution image and scroll around to perceive the radial gaps and clustering better, as well as a better perception of the increased density of points to the right of the plot. |
| Date | 31 March 2006 (original upload date) |
| Source | Transferred from en.wikipedia to Commons by Quadell using CommonsHelper. |
| Author | Mdf at English Wikipedia |
Licensing[edit]
| This work has been released into the public domain by its author, Mdf at English Wikipedia. This applies worldwide. In some countries this may not be legally possible; if so: Mdf grants anyone the right to use this work for any purpose, without any conditions, unless such conditions are required by law. |
Original upload log[edit]
The original description page was here. All following user names refer to en.wikipedia.
- 2006-03-31 20:07 Mdf 2560×2400× (111295 bytes) This is a plot of a*cos(node + peri), a*sin(node + peri) for the Minor Planet Centre's MPCORB.DAT table of asteroid elements as of 2006-03-30. It is a re-creation of fig 9.27 in Murray and Dermott's ''Solar System Dynamics'', p. 456. '''It is not a plot
File history
Click on a date/time to view the file as it appeared at that time.
| Date/Time | Thumbnail | Dimensions | User | Comment | |
|---|---|---|---|---|---|
| current | 01:37, 24 June 2009 | | 2,560 × 2,400 (109 KB) | File Upload Bot (Magnus Manske) (talk | contribs) | {{BotMoveToCommons|en.wikipedia|year={{subst:CURRENTYEAR}}|month={{subst:CURRENTMONTHNAME}}|day={{subst:CURRENTDAY}}}} {{Information |Description={{en|This is a plot of a*cos(node + peri), a*sin(node + peri) for the Minor Planet Centre's MPCORB.DAT table |
You cannot overwrite this file.
File usage on Commons
There are no pages that use this file.
File usage on other wikis
The following other wikis use this file:
- Usage on de.wikipedia.org
- Usage on en.wikipedia.org