File:Inhomogeneouspoissonprocess.svg
Jump to navigation
Jump to search

Size of this PNG preview of this SVG file: 603 × 415 pixels. Other resolutions: 320 × 220 pixels | 640 × 440 pixels | 1,024 × 705 pixels | 1,280 × 881 pixels | 2,560 × 1,762 pixels.
Original file (SVG file, nominally 603 × 415 pixels, file size: 38 KB)
Captions
Captions
Add a one-line explanation of what this file represents
Summary
[edit]| Description |
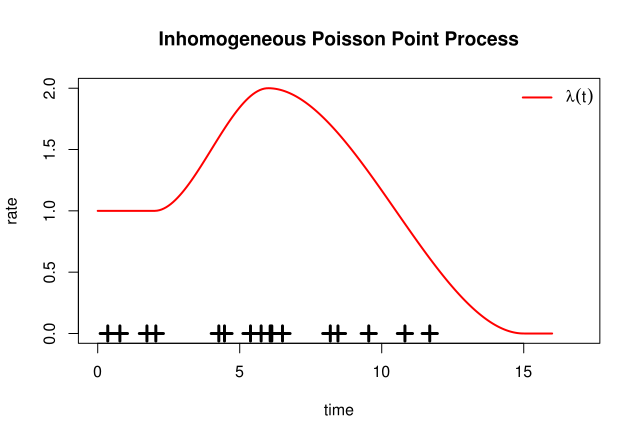
English: Graph of a inhomogeneous Poisson point process. The events are marked with black crosses, the time-dependent rate is given by the the function marked red.
Deutsch: Graph eines inhomogenen Poisson-Prozesses. Die Events sind als schwarze Kreuze markiert. Die rate , die sich im Zaufe der Zeit verändert ist in rot eingezeichnet. |
| Date | |
| Source | Own work |
| Author | NikelsenH |

Licensing
[edit]
I, the copyright holder of this work, hereby publish it under the following license:
This file is licensed under the Creative Commons Attribution-Share Alike 4.0 International license.
- You are free:
- to share – to copy, distribute and transmit the work
- to remix – to adapt the work
- Under the following conditions:
- attribution – You must give appropriate credit, provide a link to the license, and indicate if changes were made. You may do so in any reasonable manner, but not in any way that suggests the licensor endorses you or your use.
- share alike – If you remix, transform, or build upon the material, you must distribute your contributions under the same or compatible license as the original.
File history
Click on a date/time to view the file as it appeared at that time.
| Date/Time | Thumbnail | Dimensions | User | Comment | |
|---|---|---|---|---|---|
| current | 11:46, 30 December 2017 | | 603 × 415 (38 KB) | NikelsenH (talk | contribs) | User created page with UploadWizard |
You cannot overwrite this file.
File usage on Commons
There are no pages that use this file.
File usage on other wikis
The following other wikis use this file:
- Usage on de.wikipedia.org
- Usage on en.wikipedia.org