File:HeatAus3.png
Jump to navigation
Jump to search
Size of this preview: 800 × 533 pixels. Other resolutions: 320 × 213 pixels | 640 × 427 pixels | 1,024 × 683 pixels | 1,280 × 853 pixels | 2,560 × 1,707 pixels | 4,500 × 3,000 pixels.
Original file (4,500 × 3,000 pixels, file size: 102 KB, MIME type: image/png)
Captions
Captions
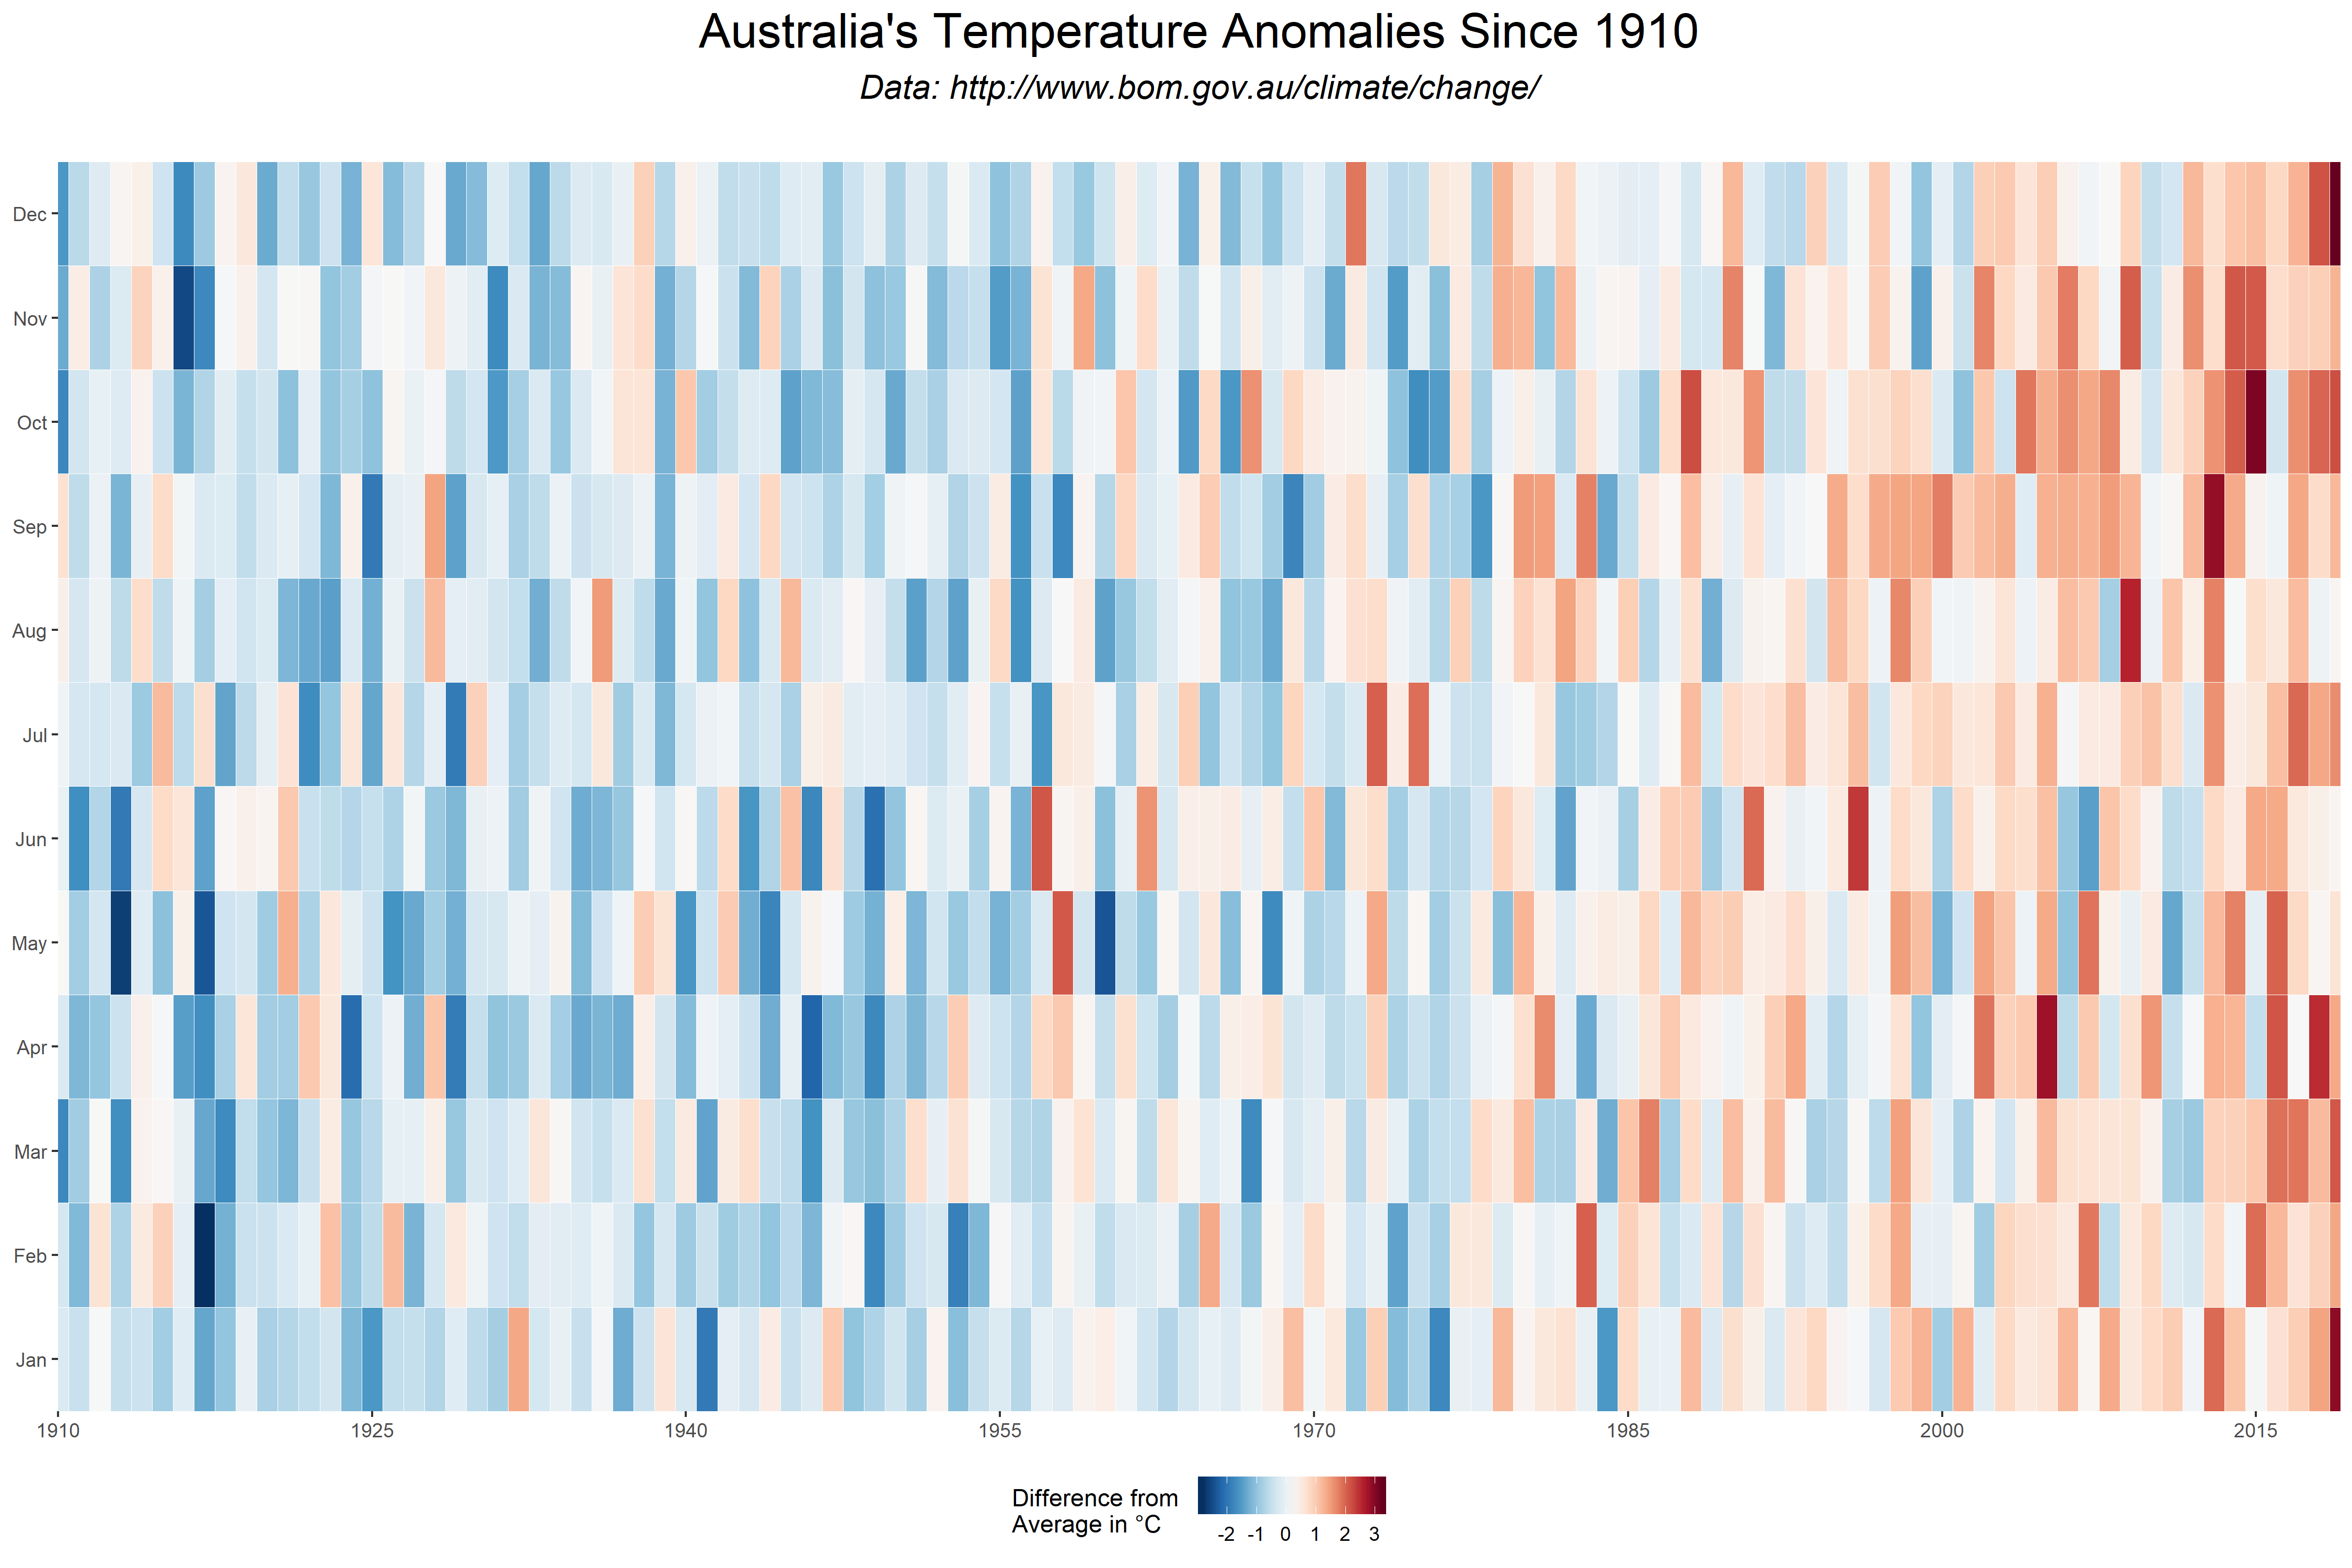
Australia's Temperature Anomalies since 1910
Summary[edit]
| Description |
English: Heatmap showing how hot or cold each month is in Australia compared to the 1960-1990 average for that month.
data from Australian Government bureau of meteorology http://www.bom.gov.au/climate/change/#tabs=Tracker&tracker=timeseries&tQ=graph%3Dtmean%26area%3Daus%26season%3Dallmonths%26ave_yr%3D0 My ggplot2 rstats code to recreate this is at https://gist.github.com/cavedave/266485943bbd2b9cb8ee8654a9d2ffa3 |
| Date | |
| Source | Own work |
| Author | David Curran |
Licensing[edit]
I, the copyright holder of this work, hereby publish it under the following license:
This file is licensed under the Creative Commons Attribution-Share Alike 4.0 International license.
- You are free:
- to share – to copy, distribute and transmit the work
- to remix – to adapt the work
- Under the following conditions:
- attribution – You must give appropriate credit, provide a link to the license, and indicate if changes were made. You may do so in any reasonable manner, but not in any way that suggests the licensor endorses you or your use.
- share alike – If you remix, transform, or build upon the material, you must distribute your contributions under the same or compatible license as the original.
File history
Click on a date/time to view the file as it appeared at that time.
| Date/Time | Thumbnail | Dimensions | User | Comment | |
|---|---|---|---|---|---|
| current | 11:55, 9 January 2020 | | 4,500 × 3,000 (102 KB) | Iamreddave (talk | contribs) | User created page with UploadWizard |
You cannot overwrite this file.
File usage on Commons
There are no pages that use this file.
File usage on other wikis
The following other wikis use this file:
- Usage on en.wikipedia.org
- Usage on kn.wikipedia.org
- Usage on pt.wikipedia.org