File:Greenland ice sheet temperatures Vinther et al 2009.png

Original file (2,006 × 1,129 pixels, file size: 472 KB, MIME type: image/png)
Captions
Captions

|
This graph image could be re-created using vector graphics as an SVG file. This has several advantages; see Commons:Media for cleanup for more information. If an SVG form of this image is available, please upload it and afterwards replace this template with
{{vector version available|new image name}}.
It is recommended to name the SVG file “Greenland ice sheet temperatures Vinther et al 2009.svg”—then the template Vector version available (or Vva) does not need the new image name parameter. |
Summary[edit]
| Description |
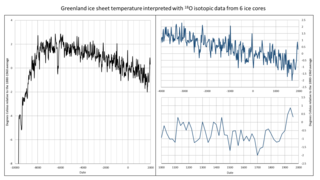
English: The temperature reconstruction produced using data from all six ice cores is shown by the black line in the attached figure, and spans the period from 9690BC to AD1970. The blue lines represent two focus on the dataset, first on the Late Holocene (or Meghalayan) and then on the last millenium. It has a resolution of around 20 years, meaning that each data point represents the average temperature of the surrounding 20 years. So, the end of the record – 1970 – shows the average temperature between 1960 and 1980.
The original data for the creation of these figures have been downloaded from the NOAA website: ftp://ftp.ncdc.noaa.gov/pub/data/paleo/icecore/greenland/vinther2009greenland.txt ORIGINAL REFERENCE: Vinther, B.M., S.L. Buchardt, H.B. Clausen, D. Dahl-Jensen, S.J. Johnsen, D.A. Fisher, R.M. Koerner, D. Raynaud, V. Lipenkov, K.K. Andersen, T. Blunier, S.O. Rasmussen, J.P. Steffensen, and A.M. Svensson. 2009. Holocene thinning of the Greenland ice sheet. Nature, Vol. 461, pp. 385-388, 17 September 2009. doi:10.1038/nature08355 SEE ALSO: Factcheck: What Greenland ice cores say about past and present climate change https://www.carbonbrief.org/factcheck-what-greenland-ice-cores-say-about-past-and-present-climate-change |
| Date | |
| Source | Own work |
| Author | Ambactos55 |
I made these figures to propose a correct version of the previous figure made by Artreve. His version used incorrectly the stated baseline (1880-1960 average) and missed the last centuries from the dataset.
Licensing[edit]
- You are free:
- to share – to copy, distribute and transmit the work
- to remix – to adapt the work
- Under the following conditions:
- attribution – You must give appropriate credit, provide a link to the license, and indicate if changes were made. You may do so in any reasonable manner, but not in any way that suggests the licensor endorses you or your use.
File history
Click on a date/time to view the file as it appeared at that time.
| Date/Time | Thumbnail | Dimensions | User | Comment | |
|---|---|---|---|---|---|
| current | 18:05, 23 January 2020 | | 2,006 × 1,129 (472 KB) | Ambactos55 (talk | contribs) | Better frame and clipping. |
| 17:45, 23 January 2020 |  | 1,937 × 1,090 (268 KB) | Ambactos55 (talk | contribs) | {{Information |description ={{en|1=The temperature reconstruction produced using data from all six ice cores is shown by the black line in the attached figure, and spans the period from 9690BC to AD1970. The blue lines represent two focus on the dataset, first on the Late Holocene (or Meghalayan) and then on the last millenium. It has a resolution of around 20 years, meaning that each data point represents the average temperature of the surrounding 20 years. So, the end of the record – 1970... |
You cannot overwrite this file.
File usage on Commons
There are no pages that use this file.
File usage on other wikis
The following other wikis use this file:
- Usage on ar.wikipedia.org
- Usage on en.wikipedia.org
- Usage on es.wikipedia.org
- Usage on fr.wikipedia.org
- Usage on ig.wikipedia.org
- Usage on tr.wikipedia.org