File:Gauss function.svg
Jump to navigation
Jump to search

Size of this PNG preview of this SVG file: 600 × 600 pixels. Other resolutions: 240 × 240 pixels | 480 × 480 pixels | 768 × 768 pixels | 1,024 × 1,024 pixels | 2,048 × 2,048 pixels | 1,000 × 1,000 pixels.
Original file (SVG file, nominally 1,000 × 1,000 pixels, file size: 670 KB)
Captions
Captions
Add a one-line explanation of what this file represents
Summary[edit]
| Description |
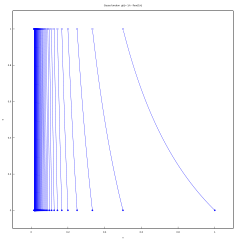
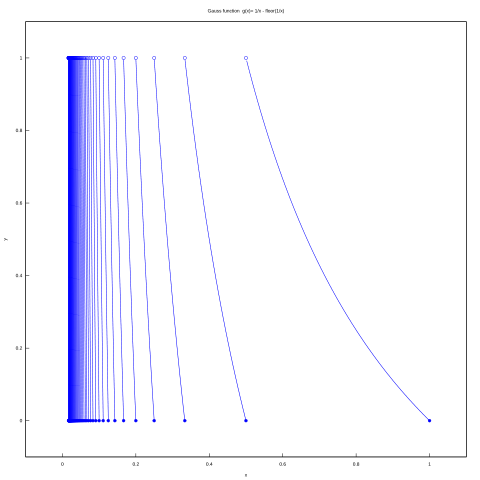
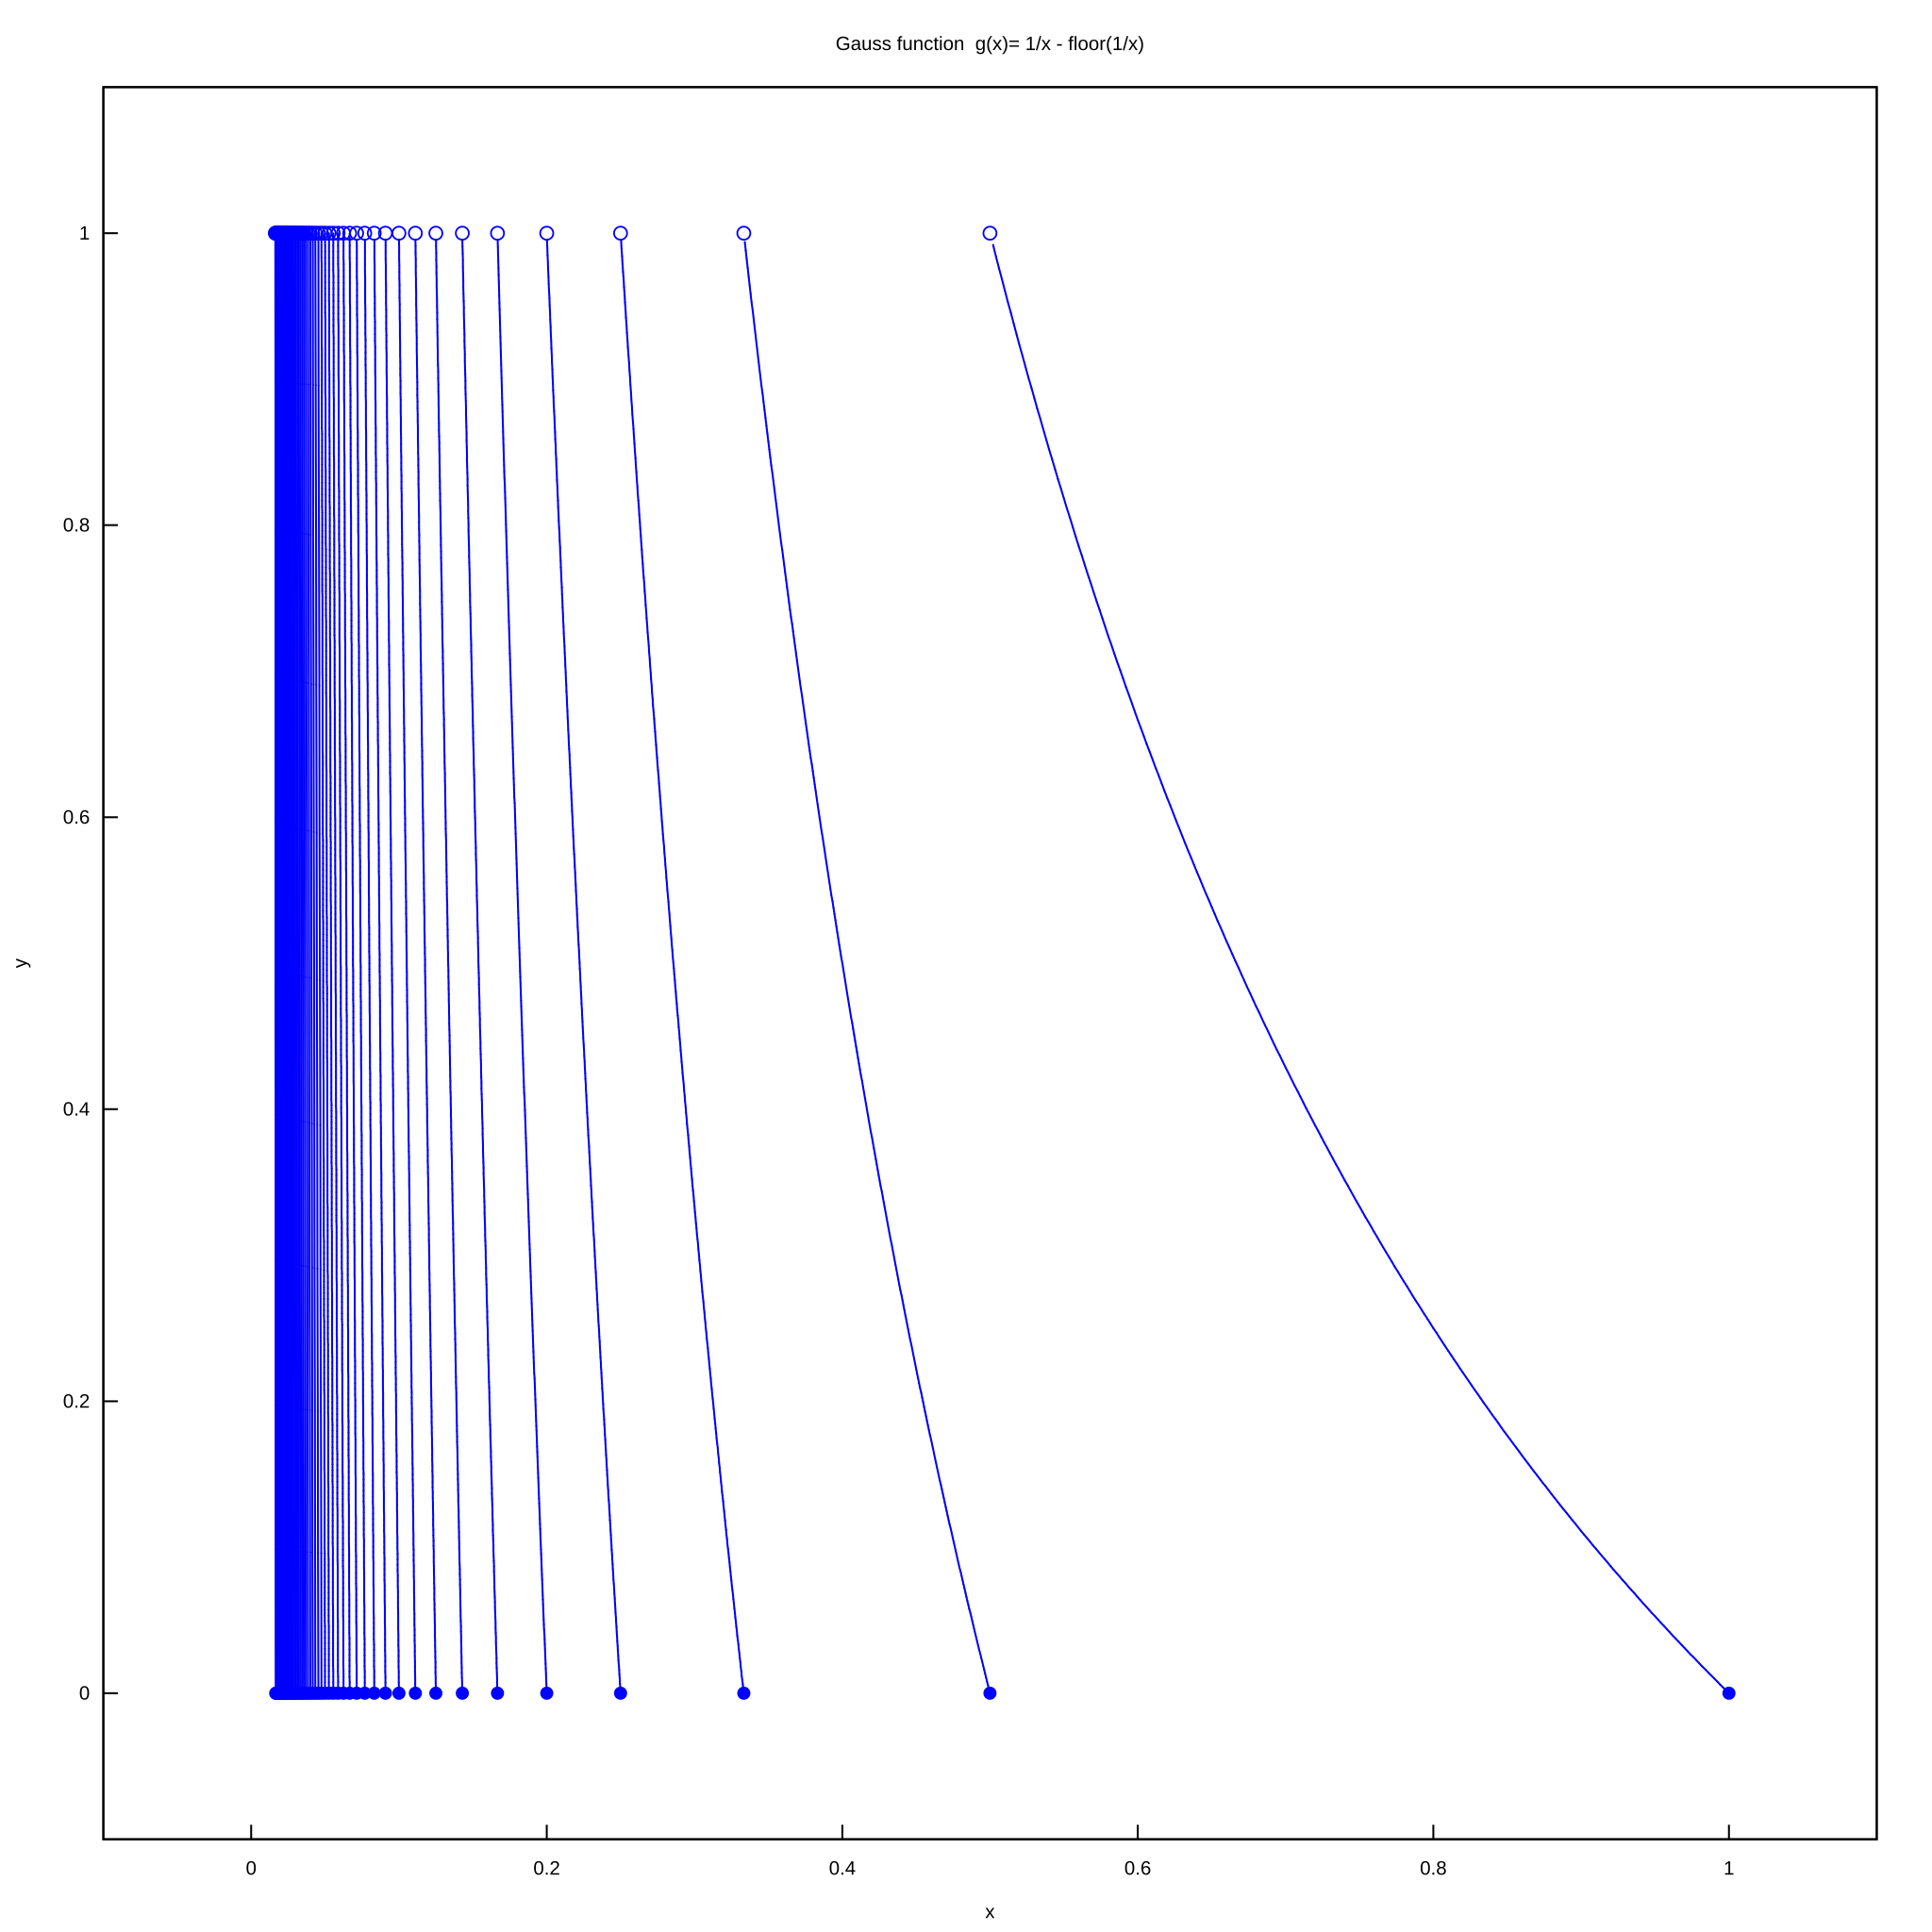
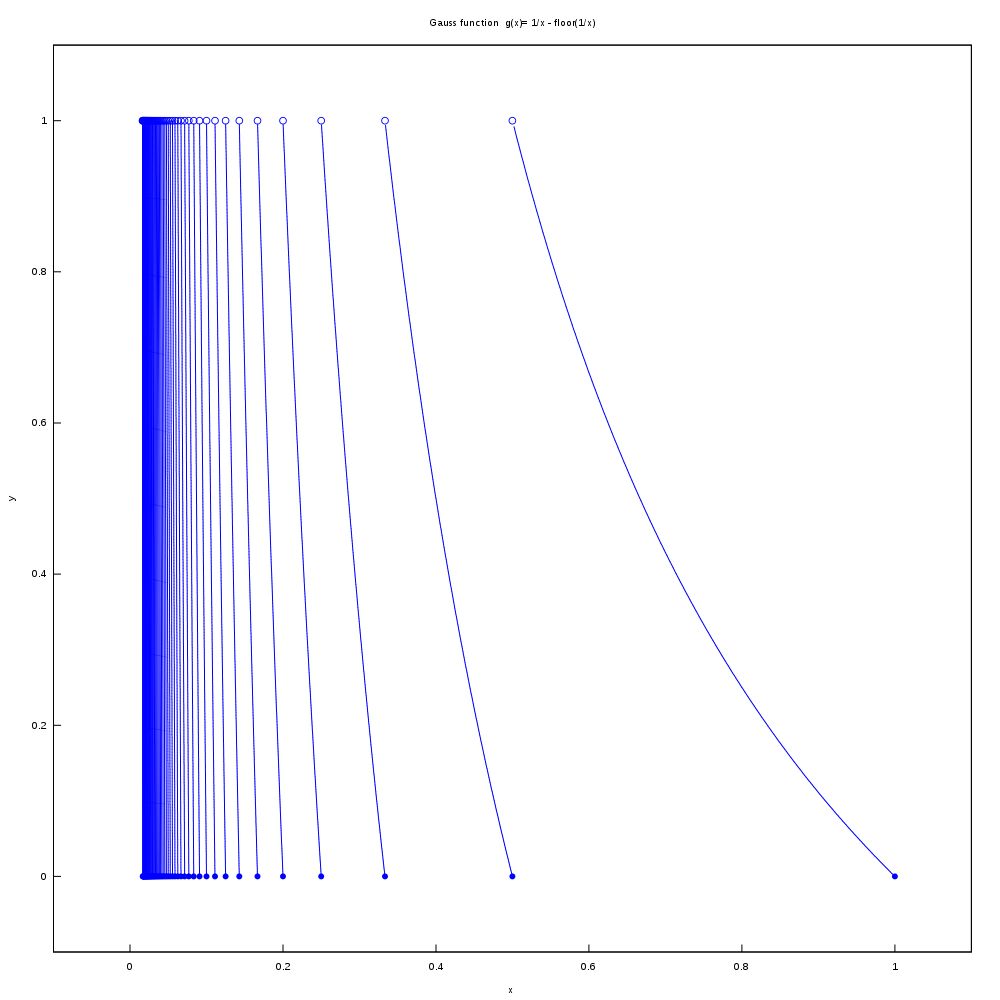
English: Gauss function f(x) = 1/x - floor(1/x) |
| Date | |
| Source | own work with help of Robert Dodier |
| Author | Adam majewski |
Licensing[edit]
I, the copyright holder of this work, hereby publish it under the following license:
This file is licensed under the Creative Commons Attribution-Share Alike 4.0 International license.
- You are free:
- to share – to copy, distribute and transmit the work
- to remix – to adapt the work
- Under the following conditions:
- attribution – You must give appropriate credit, provide a link to the license, and indicate if changes were made. You may do so in any reasonable manner, but not in any way that suggests the licensor endorses you or your use.
- share alike – If you remix, transform, or build upon the material, you must distribute your contributions under the same or compatible license as the original.
Maxima Cas src code[edit]
One can draw using simple command :
f(x):= 1/x - floor(1/x); plot2d(f(x),[x,0,1]);
For more precise drawing
- split curve into segments
- add end points
/*


https://stackoverflow.com/questions/49587741/how-to-draw-graph-of-gauss-function


Batch file for Maxima CAS
save as a g.mac
run maxima :
 maxima
and then :
batch("g.mac");

*/


kill(all);
remvalue(all);
ratprint:false;


/* ---------- functions ---------------------------------------------------- */


/*
Gauss function
https://en.wikipedia.org/wiki/Gauss%E2%80%93Kuzmin%E2%80%93Wirsing_operator#The_Gaus_map

f: x -> y

*/
f(x):= 1/x - floor(1/x)$

/*

g : x -> x+y*i

*/

g(x):= x+f(x)*%i$


/*
converts complex number z = x*y*%i
to the list in a draw format:
[x,y]
*/
draw_f(z):=[float(realpart(z)), float(imagpart(z))]$

/* give Draw List from one point*/
dl(z):=points([draw_f(z)])$

ToPoints(myList):= points(map(draw_f , myList))$


/* gives part of graph */
GivePart(n):=(
	[Part,  xMax, xMin, dx, iMax],

	if (n>20) then iMax:10
	  else iMax : 250,
	xMax : 1/n,
	xMin : 1/(n+1),
	dx : (xMax - xMin)/iMax,
	Part : makelist(xMin + i*dx, i, 0, iMax),

	Part : map(g, Part),
	Part[1] : xMin + %i, /* lower semi-continuous function */
	Part

)$


GiveClosedPoint(z):=

	[point_type = filled_circle,
	points_joined    =  false,
	point_size    =  0.8,
	dl(z)]$


GiveOpenPoint(z):=

	[point_type = circle,
	points_joined    =  false,
	point_size    =  0.9,
	dl(z)]$


/*

*/
AddEndPoints(MyList):=(
	[zLeft, zRight],
	zLeft : first(MyList),
	if (realpart(zLeft)>0.07) then MyList: delete(zLeft, MyList ),
	zRight : last(MyList),
	MyList :ToPoints(MyList),
	MyList : [GiveOpenPoint(zLeft),point_type = filled_circle, points_joined =true, point_size    =  0.1, MyList, points_joined = false, GiveClosedPoint(zRight)]


)$


GiveList(i_Max):=(
	[Part, PartList ],
	PartList:[],
	for i:1 thru i_Max step 1 do (
		Part:  GivePart(i),
		Part : AddEndPoints(Part),
		PartList : cons(Part, PartList)

	),
	PartList


)$


compile(all);

nMax:60;


/* computations */


pp:GiveList(nMax)$


/* draw */

path:"~/maxima/batch/gauss/test/slim/"$ /*  pwd, if empty then file is in a home dir , path should end with "/" */

/* draw it using draw package by */

 load(draw);
/* if graphic  file is empty (= 0 bytes) then run draw2d command again */

 draw2d(
  user_preamble="set key top right; unset mouse",
  terminal  = 'svg,
  file_name = sconcat(path,"gauss", string(nMax), "a"),
  font = "Liberation Sans", /* https://commons.wikimedia.org/wiki/Help:SVG#Font_substitution_and_fallback_fonts */
  title= "Gauss function  g(x)= 1/x - floor(1/x)",
    /*  */
  dimensions = [1000, 1000],

  yrange = [-0.1,1.1],
  xrange = [-0.1,1.1],


  xlabel     = "x ",
  ylabel     = "y",

  color         = blue,
  key = "",
  pp /* draw accepts list of parameters and data */

   )$
This plot was created with Gnuplot.
File history
Click on a date/time to view the file as it appeared at that time.
| Date/Time | Thumbnail | Dimensions | User | Comment | |
|---|---|---|---|---|---|
| current | 16:40, 5 April 2018 | | 1,000 × 1,000 (670 KB) | Soul windsurfer (talk | contribs) | smaller size due to : if (n>20) then iMax:10 else iMax : 250, |
| 15:35, 2 April 2018 |  | 1,000 × 1,000 (1.7 MB) | Soul windsurfer (talk | contribs) | User created page with UploadWizard |
You cannot overwrite this file.
File usage on Commons
There are no pages that use this file.
File usage on other wikis
The following other wikis use this file:
- Usage on en.wikipedia.org
- Usage on pl.wikipedia.org