File:Gamma distribution.svg

Original file (SVG file, nominally 600 × 480 pixels, file size: 73 KB)
Captions
Captions
| Description |
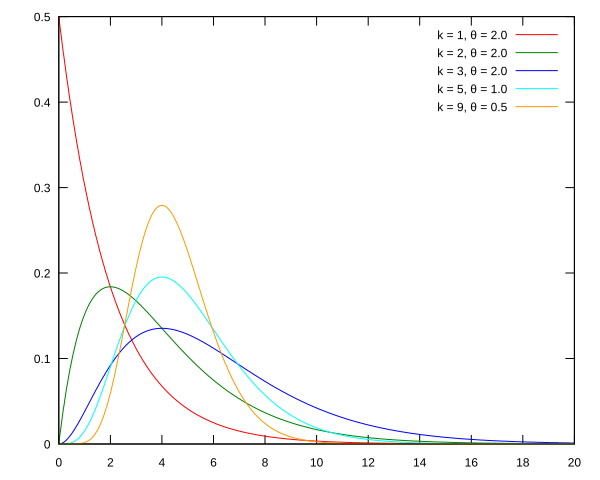
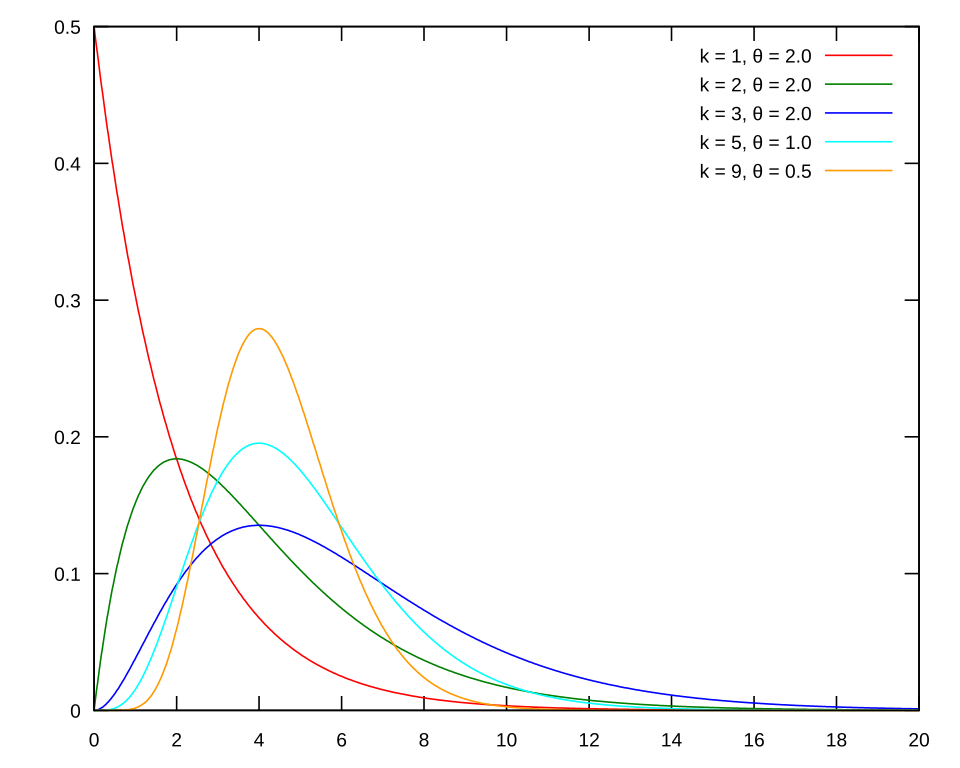
Probability density function for the Gamma distribution (vector version of Image:Gamma_distribution_pdf.png
|
||||||||
| Date | |||||||||
| Source | derived from GFDL work | ||||||||
| Author | Toobaz | ||||||||
| Permission (Reusing this file) |
GFDL |
gnuplot source under GPL:
 _ln_dgamma(x, a, b) = a*log(b) - lgamma(a) + (a-1)*log(x) - b*x
 dgamma(x, shape, rate) =\
  (x<0)? 0 :\
  (x==0)? ((shape<1)? 1/0 : (shape==1)? rate : 0) :\
  (rate==0)? 0 :\
  exp(_ln_dgamma(x, shape, rate))
 pgamma(x, shape, rate) = (x<0)? 0 : igamma(shape, x*rate)

 set samples 1001
 set terminal svg
 set output

 set xtics 0,2
 set ytics 0,0.1

 f(x, k, t) = dgamma(x, k, 1.0/t)
 set key top right

 #f(x, k, t) = pgamma(x, k, 1.0/t)
 #set key bottom right

 plot [0:20] \
     f(x,1,2.0) title "k = 1, θ = 2.0", \
     f(x,2,2.0) title "k = 2, θ = 2.0", \
     f(x,3,2.0) title "k = 3, θ = 2.0", \
     f(x,5,1.0) title "k = 5, θ = 1.0", \
     f(x,9,0.5) title "k = 9, θ = 0.5" lt 7

|
This work is free software; you can redistribute it and/or modify it under the terms of the GNU General Public License as published by the Free Software Foundation; either version 2 of the License, or any later version. This work is distributed in the hope that it will be useful, but without any warranty; without even the implied warranty of merchantability or fitness for a particular purpose. See version 2 and version 3 of the GNU General Public License for more details. |
File history
Click on a date/time to view the file as it appeared at that time.
| Date/Time | Thumbnail | Dimensions | User | Comment | |
|---|---|---|---|---|---|
| current | 05:01, 8 March 2008 | | 600 × 480 (73 KB) | Toobaz (talk | contribs) | {{Information |Description=Probability density function for the Gamma distribution (vector version of Image:Gamma_distribution_pdf.png{{GFDL}}) |Source=derived from GFDL work |Date=08 Mar 2008 |Author= Toobaz |Permission=GFDL }} gnu |
You cannot overwrite this file.
File usage on Commons
There are no pages that use this file.