File:FukushimaRadiationPlot-Log-Mar19.png
Jump to navigation
Jump to search
Size of this preview: 800 × 309 pixels. Other resolutions: 320 × 124 pixels | 1,200 × 464 pixels.
Original file (1,200 × 464 pixels, file size: 93 KB, MIME type: image/png)
Captions
Captions
Add a one-line explanation of what this file represents

|
This graph image could be re-created using vector graphics as an SVG file. This has several advantages; see Commons:Media for cleanup for more information. If an SVG form of this image is available, please upload it and afterwards replace this template with
{{vector version available|new image name}}.
It is recommended to name the SVG file “FukushimaRadiationPlot-Log-Mar19.svg”—then the template Vector version available (or Vva) does not need the new image name parameter. |
This raster image uses subpixel rendering not appropriate for all uses (scaling, different displays types and printing).
Summary[edit]
| Description |
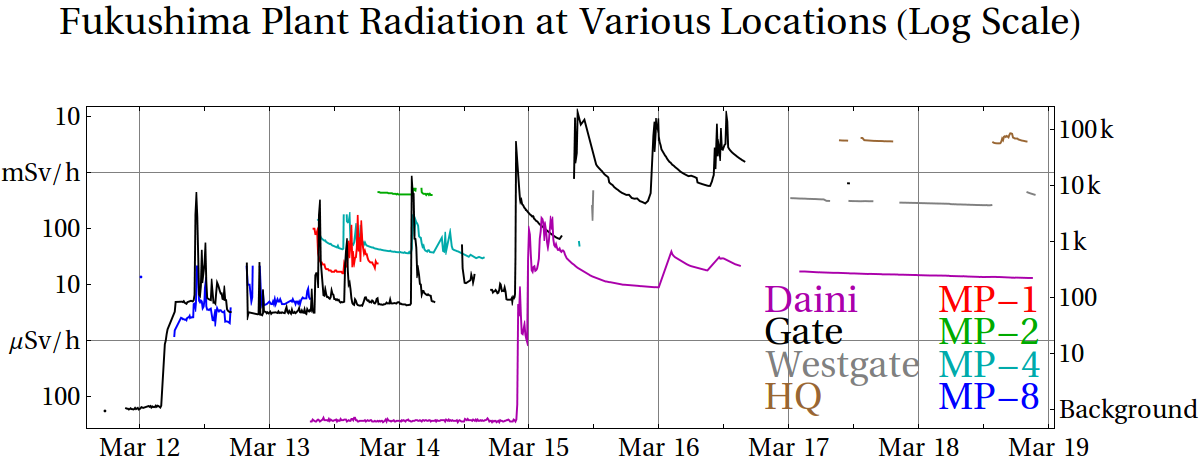
English: A logarithmic plot of the radiation levels at various monitoring points at the Fukushima I and Fukushima II Nuclear Power Plant during the crisis caused by the 2011 Tōhoku earthquake and tsunami. Data collected from TEPCO's webpage: [1]
Français : En échelle logarithmique, les niveaux de rayonnement mesurés en plusieurs points au voisinage du site nucléaire de Fukushima au moment de l'accident nucléaire de mars 2011. à mettre en relation avec : 12 mars 15h36 Explosion sur le réacteur n°1 ; 14 mars 11h01, Explosion sur le réacteur n°3 ; 15 mars 06h10, Explosion sur le réacteur n°2 ; 15 mars 09h38, Explosion sur le réacteur n°4 (source : article fr.wp, 19 mars 2011).
日本語: 2011年の東北地方太平洋沖地震による福島第一原子力発電所事故の際に、福島第一・第二原発所内の各地点で観測された放射線レベルのグラフ。データは東京電力のウェブサイト [2] による。 |
| Date | |
| Source | Own work |
| Author | Xerxes314 |
| Other versions | Derivative works of this file: RadioactivitéFukushima.png |
Licensing[edit]
I, the copyright holder of this work, hereby publish it under the following license:
This file is licensed under the Creative Commons Attribution-Share Alike 3.0 Unported license.
- You are free:
- to share – to copy, distribute and transmit the work
- to remix – to adapt the work
- Under the following conditions:
- attribution – You must give appropriate credit, provide a link to the license, and indicate if changes were made. You may do so in any reasonable manner, but not in any way that suggests the licensor endorses you or your use.
- share alike – If you remix, transform, or build upon the material, you must distribute your contributions under the same or compatible license as the original.
File history
Click on a date/time to view the file as it appeared at that time.
| Date/Time | Thumbnail | Dimensions | User | Comment | |
|---|---|---|---|---|---|
| current | 18:16, 18 March 2011 | 1,200 × 464 (93 KB) | Xerxes314 (talk | contribs) | {{Information |Description ={{en|1=A logarithmic plot of the radiation levels at various monitoring points at the Fukushima I and Fukushima II Nuclear Power Pl |
You cannot overwrite this file.
File usage on Commons
The following 2 pages use this file:
File usage on other wikis
The following other wikis use this file:
- Usage on ca.wikipedia.org
- Usage on da.wikipedia.org
- Usage on fr.wikipedia.org
- Usage on fr.wikinews.org
- Usage on sh.wikipedia.org
- Usage on sr.wikipedia.org
- Usage on zh.wikipedia.org