File:Fuerth Bevoelkerungsentwicklung.svg
Jump to navigation
Jump to search

Size of this PNG preview of this SVG file: 800 × 400 pixels. Other resolutions: 320 × 160 pixels | 640 × 320 pixels | 1,024 × 512 pixels | 1,280 × 640 pixels | 2,560 × 1,280 pixels.
Original file (SVG file, nominally 800 × 400 pixels, file size: 41 KB)
Captions
Captions
Add a one-line explanation of what this file represents
Summary[edit]
| Description |
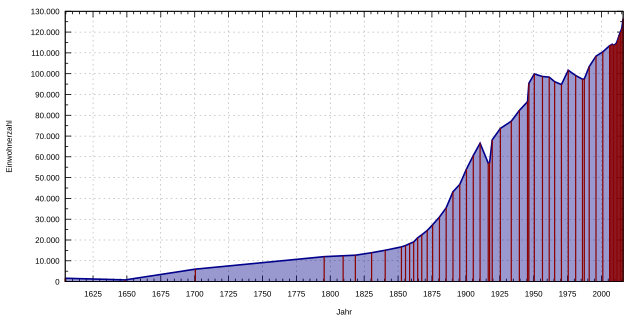
Deutsch: Bevölkerungsentwicklung der Stadt Fürth seit 1604. Datenquelle: http://de.wikipedia.org/wiki/Fürth English: Population of Fürth since 1604. Data source: http://de.wikipedia.org/wiki/Fürth |
| Date | |
| Source | Own work |
| Author | Michael Fiedler |
Licensing[edit]
I, the copyright holder of this work, hereby publish it under the following license:
This file is licensed under the Creative Commons Attribution-Share Alike 3.0 Unported license.
- You are free:
- to share – to copy, distribute and transmit the work
- to remix – to adapt the work
- Under the following conditions:
- attribution – You must give appropriate credit, provide a link to the license, and indicate if changes were made. You may do so in any reasonable manner, but not in any way that suggests the licensor endorses you or your use.
- share alike – If you remix, transform, or build upon the material, you must distribute your contributions under the same or compatible license as the original.
Gnuplot script to generate this plot[edit]
#!/usr/bin/gnuplot
# gnuplot 4.6 / Debian 7
#
# Erstellt von Michael Fiedler <michael.fiedler87@gmx.de>
# Lizenz: CC-BY-SA 3.0 unported, https://creativecommons.org/licenses/by-sa/3.0/deed.de
# Basierend auf http://commons.wikimedia.org/wiki/File:Muc_population.svg von Gorgo

# Code weitgehend umgestaltet im Aug. 2017 (user:Summer ... hier!)

# da wir zwei Plots mit den Daten machen speichern wir
# sie in einem Temp-File
system "cat > /tmp/datafile <<HEREDOC\n\
30.06.1604 1600\n\
30.06.1648 800\n\
30.06.1700 6000\n\
30.06.1795 12000\n\
30.06.1809 12438\n\
30.06.1818 12700\n\
30.06.1830 13900\n\
30.06.1840 15100\n\
30.06.1852 16700\n\
30.06.1855 17341\n\
30.06.1858 18241\n\
30.06.1861 19100\n\
30.06.1864 21100\n\
30.06.1867 22500\n\
30.06.1871 24580\n\
30.06.1875 27360\n\
30.06.1880 31063\n\
30.06.1885 35455\n\
30.06.1890 43206\n\
30.06.1895 46726\n\
30.06.1900 54144\n\
30.06.1905 60635\n\
30.06.1910 66553\n\
30.06.1916 56967\n\
30.06.1917 57282\n\
30.06.1919 68162\n\
30.06.1925 73693\n\
30.06.1933 77135\n\
30.06.1939 82315\n\
30.06.1945 86515\n\
30.06.1946 95369\n\
30.06.1950 99890\n\
30.06.1956 98643\n\
30.06.1961 98332\n\
30.06.1965 96125\n\
30.06.1970 94774\n\
30.06.1975 101639\n\
31.12.1980 99088\n\
31.12.1985 97331\n\
25.05.1987 97480\n\
31.12.1990 103362\n\
31.12.1995 108418\n\
31.12.2000 110477\n\
31.12.2005 113459\n\
31.12.2006 113767\n\
31.12.2007 114130\n\
31.12.2008 113661\n\
31.12.2009 114044\n\
31.12.2010 114628\n\
31.12.2011 116317\n\
31.12.2012 118358\n\
31.12.2013 120000\n\
31.12.2014 121754\n\
31.12.2015 126405\n\
HEREDOC\n"


#input
set timefmt "%d.%m.%Y"
set datafile separator " "


#output
unset key
set style data lines
set style fill transparent solid 0.4
set grid


set xdata time
set xlabel 'Jahr'
set xrange ['30.06.1604':'31.12.2015']
set xtics '01.01.1600', 60 * 60 * 24 * 365.25 * 25
                      #  xtics in Sekunden:
                      # der Beginn der X-Einteilung kann außerhalb xrange
                      # liegen
set mxtics 5          # Unterteilung
set format x '%Y'     # Beschriftungsformat JJJJ


set ylabel 'Einwohnerzahl'
set ytics 10000
set mytics 2
set decimalsign locale "de_DE.utf8"
set decimal     locale "de_DE.utf8"
set format y  "%'.0f"  # Ausgabeformat


set term svg size 800,400 font "Arial,10"
set output 'Fuerth_Bevoelkerungsentwicklung.svg'


plot "/tmp/datafile" using 1:2 with filledcurves below x1 linetype rgb 'dark-blue' linewidth 2, \
     "/tmp/datafile" using 1:2 with impulses linecolor rgbcolor 'dark-red' linewidth 1.5
File history
Click on a date/time to view the file as it appeared at that time.
| Date/Time | Thumbnail | Dimensions | User | Comment | |
|---|---|---|---|---|---|
| current | 12:41, 24 August 2017 | | 800 × 400 (41 KB) | Summer ... hier! (talk | contribs) | Komplett neue Grafik mit zusätzlichen Daten für 2014-15. Diverses wie Schriftgröße. Code komplett neu unter Beibehaltung von zwei Plots (filledcurves und impulses). Um die Daten für die beiden Plots nicht doppelt zu halten werden sie über ein Tem... |
| 00:29, 13 May 2014 |  | 1,500 × 800 (70 KB) | Simified (talk | contribs) | User created page with UploadWizard |
You cannot overwrite this file.
File usage on Commons
There are no pages that use this file.
File usage on other wikis
The following other wikis use this file:
- Usage on hy.wikipedia.org