File:Foreclosure trend - 2007.svg

Original file (SVG file, nominally 395 × 407 pixels, file size: 15 KB)
Captions
Captions
Summary[edit]
| Description |
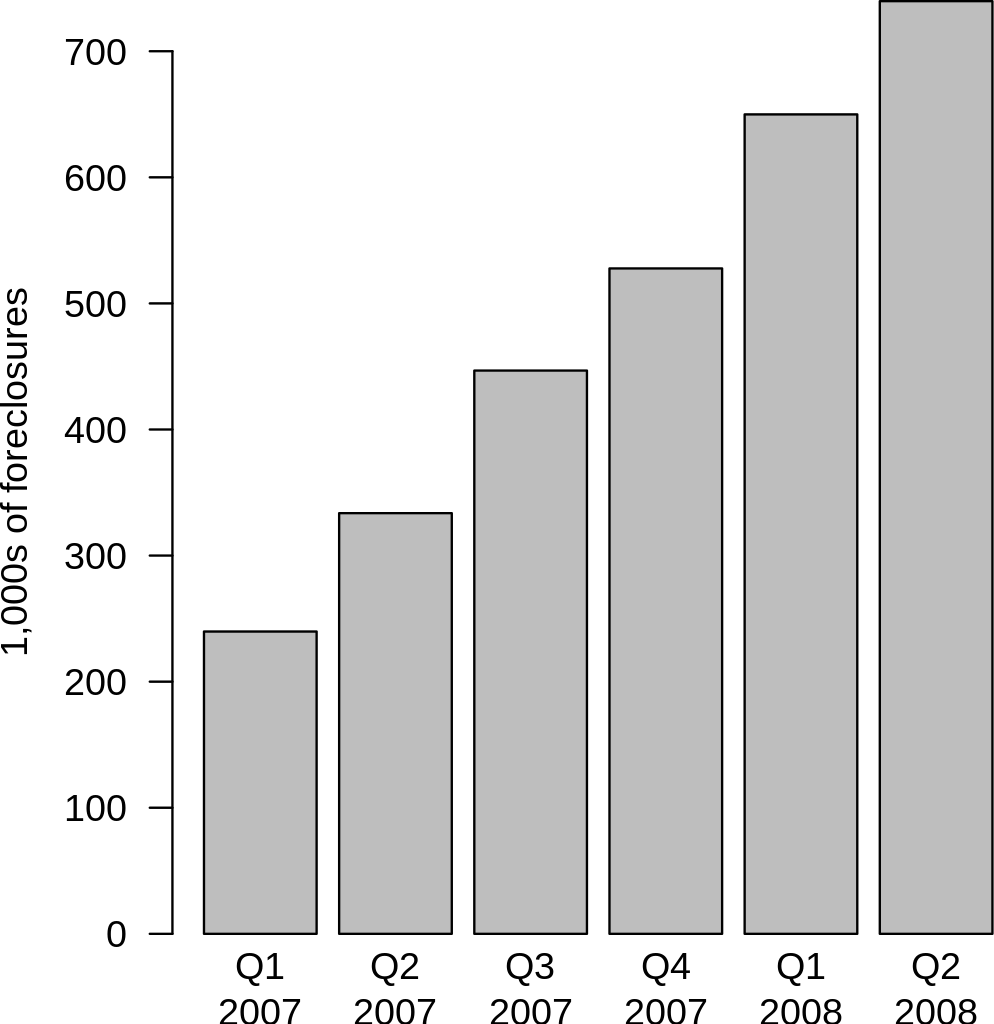
English: This data was publicly disclosed by RealtyTrac through press releases available on their website, some of which are cited in the 2007 Subprime Mortgage Financial Crisis article directly. I created the table from this data. I have calculated the Q1 and Q2 2007 data as follows:
Note that this adds to 1,547,863, not the 1,285,873 RealtyTrac cited for full year. The following is an explanation from RealtyTrac: "The reason for the numbers not adding up is that we run the reports for the year-end separately; we don’t just add up all the quarters. Because of the way the report is designed, it only counts each property once during the entire year even if the property has multiple filings against it during the timeframe used for the report. So when we run it for the entire year, the number will be lower than adding up all the quarters because there will be some properties that appeared in multiple quarters because they had foreclosure activity against them in more than one quarter." RealtyTrac includes default notices, auction sale notices and bank repossessions in its reporting and can include multiple filings on the same property. The number of total notices was 2.2 million for 2007, as cited in the year-end press release. |
| Source | Own work |
| Author | Emok |
| Other versions | Image:Foreclosure_Trend_-_2007.png |
R source code:
date<-c("Q1\n2007","Q2\n2007","Q3\n2007","Q4\n2007","Q1\n2008","Q2\n2008")
foreclosures<-c(239770,333627,446726,527740,649917,739714)
pdf('foreclosures.pdf', width=5, height=6)
barplot(foreclosures/1000, ylab="1,000s of foreclosures", las=1, names.arg=date)
dev.off()
Licensing[edit]
- You are free:
- to share – to copy, distribute and transmit the work
- to remix – to adapt the work
- Under the following conditions:
- attribution – You must give appropriate credit, provide a link to the license, and indicate if changes were made. You may do so in any reasonable manner, but not in any way that suggests the licensor endorses you or your use.
- share alike – If you remix, transform, or build upon the material, you must distribute your contributions under the same or compatible license as the original.

|
Permission is granted to copy, distribute and/or modify this document under the terms of the GNU Free Documentation License, Version 1.2 or any later version published by the Free Software Foundation; with no Invariant Sections, no Front-Cover Texts, and no Back-Cover Texts. A copy of the license is included in the section entitled GNU Free Documentation License. |
File history
Click on a date/time to view the file as it appeared at that time.
| Date/Time | Thumbnail | Dimensions | User | Comment | |
|---|---|---|---|---|---|
| current | 18:10, 24 September 2008 | | 395 × 407 (15 KB) | Emok (talk | contribs) | {{Information |Description={{en|1=This data was publicly disclosed by RealtyTrac through press releases available on their website, some of which are cited in the 2007 Subprime Mortgage Financial Crisis article directly. I created the table from this dat |
You cannot overwrite this file.
File usage on Commons
There are no pages that use this file.
File usage on other wikis
The following other wikis use this file:
- Usage on en.wikipedia.org
- Usage on th.wikipedia.org
- Usage on vi.wikipedia.org