File:Exponential Function (Abs Imag Part at Infinity) Density.png
Jump to navigation
Jump to search
Size of this preview: 728 × 600 pixels. Other resolutions: 292 × 240 pixels | 583 × 480 pixels | 850 × 700 pixels.
Original file (850 × 700 pixels, file size: 130 KB, MIME type: image/png)
Captions
Captions
Add a one-line explanation of what this file represents
| Description |
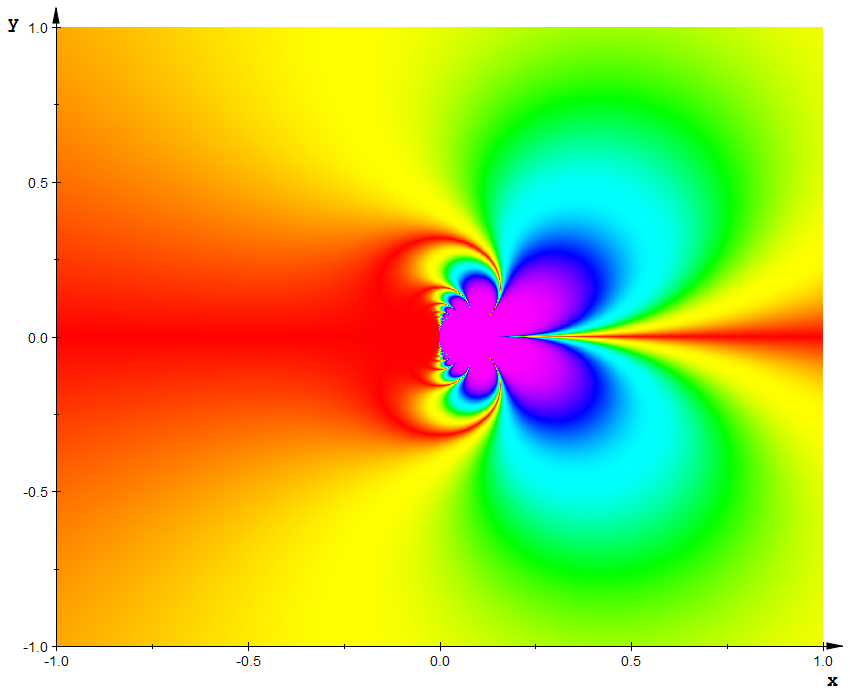
Diagram of the absolute value of the real part of the exponential function in the complex plane, as the operand approaches infinity. The plot is given by: |
||
| Date | |||
| Source | Own drawing, Plotted in MuPAD, code given below. | ||
| Author | Inductiveload | ||
| Permission (Reusing this file) |
|
||
| Other versions | See Exponential function for related graphics. |

MuPAD Code[edit]
_Density.png&action=edit§ion=1)
 f := abs(Im(exp(1/(x+I*y)))):

  ylimit := 1:
  xlimit := 1:
  mesh := 1000:     //resolution of density plot

a    := 1:   //change this to adjust the colour band drop-of rate
fmin := 0:  //minimum value of colour function (i.e the one with arctan in it)
fmax := 1:  //maximum value of colour function
range:= 1:  //for brevity

colour := proc(c)
 begin
    if   c <  fmin then
       return ([1, 0, 0])  //this term may not be needed, but it means we can deal with slightly under-limit values
    elif c <= fmin + 1*range/6  then
       return ([1, abs(sin((c-fmin)*(PI/2)/(range/6))^a), 0])
    elif c <= fmin + 2*range/6 then
       return ([abs(sin((c-fmin)*(PI/2)/(range/6))^a), 1, 0])
    elif c <= fmin + 3*range/6 then
       return ([0, 1, abs(-sin((c-fmin)*(PI/2)/(range/6))^a)])
    elif c <= fmin + 4*range/6 then
       return ([0, abs(-sin((c-fmin)*(PI/2)/(range/6))^a), 1])
    elif c <= fmin + 5*range/6 then
       return ([abs(sin((c-fmin)*(PI/2)/(range/6))^a), 0, 1])
    elif c <= fmin + 6*range/6 then
       return ([1, 0, abs(sin((c-fmin)*(PI/2)/(range/6))^a)])
    else
       return ([1, 0,1])
  end_if
end_proc:

  colfunc := (x,y,z) -> colour(arctan(z/2)*(5.0001/6)/(0.5*PI)): //the factor of 5/6 prevents the spectrum from wrapping
                                                                // by precisely one colour transition (m->r).
                                                                //The extra 0.00001 is to prevent an error when evaluating the 5th elif clause.
                                                                //No idea why, but it must be sometihng to do with there being a 5/6 in there.


  cplot := plot::Density(f,
                         x = -xlimit..xlimit,
                         y = -ylimit..ylimit,
                         AntiAliased = TRUE,
                         Mesh = [mesh, mesh],
                         AxesTitleFont = ["Courier New", Bold, 14],
                         TicksLabelFont = ["Arial", 10],
                         FillColorFunction = colfunc,
                         YTicksDistance = 0.5,
                         XTicksDistance = 0.5):

  time((plot(cplot,
             Axes = Frame,
             Width = 8.5*unit::inch,
             Height = 7*unit::inch)))*sec/1000.0
File history
Click on a date/time to view the file as it appeared at that time.
| Date/Time | Thumbnail | Dimensions | User | Comment | |
|---|---|---|---|---|---|
| current | 18:25, 25 April 2007 | | 850 × 700 (130 KB) | Inductiveload (talk | contribs) | {{Information |Description=Diagram of the absolute value of the real part of the exponential function in the complex plane, as the operand approaches infinity. The plot is given by: ::<math>z=\bigg|\operatorname{Im} \left (\exp \left( \frac{1}{x + i y} \r |
| 18:19, 25 April 2007 |  | 850 × 700 (130 KB) | Inductiveload (talk | contribs) | Reverted to earlier revision | |
| 18:11, 25 April 2007 |  | 850 × 700 (130 KB) | Inductiveload (talk | contribs) | Reverted to earlier revision | |
| 18:09, 25 April 2007 |  | 850 × 700 (130 KB) | Inductiveload (talk | contribs) | New smoother colour scheme | |
| 18:08, 25 April 2007 |  | 850 × 700 (130 KB) | Inductiveload (talk | contribs) | New smoother colour scheme. | |
| 02:06, 22 April 2007 |  | 850 × 700 (139 KB) | Inductiveload (talk | contribs) | {{Information |Description=Diagram of the absolute value real part of exponetial function in the complex plane, as the operand approaches infinity. The plot is given by: ::<math>z=\bigg|\operatorname{Im} \left (\exp \left( \frac{1}{x + i y} \right)\right) |
You cannot overwrite this file.
File usage on Commons
The following page uses this file:
_Density.png&oldid=553660826)