File:Evolutie bevolkingsaantal Beauvoorde.svg
Jump to navigation
Jump to search

Size of this PNG preview of this SVG file: 184 × 144 pixels. Other resolutions: 307 × 240 pixels | 613 × 480 pixels | 981 × 768 pixels | 1,280 × 1,002 pixels | 2,560 × 2,003 pixels.
Original file (SVG file, nominally 184 × 144 pixels, file size: 3 KB)
Captions
Captions
Add a one-line explanation of what this file represents
Summary
[edit]
| Description |
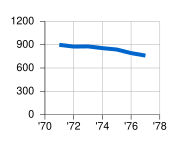
Nederlands: Ploticus-plot van de evolutie van het bevolkingsaantal van nl:Beauvoorde
Gebruikte code: #proc getdata
data:
1971 898
1972 876
1973 878
1974 856
1975 838
1976 792
1977 760
#proc areadef
xscaletype date yyyy
xrange 1971 1977
yrange 0 900
xaxis.stubs: inc 1 year
xaxis.stubformat: yyyy
xaxis.grid: width=0.5 color=gray(0.7)
yaxis.stubs: inc 300
yaxis.grid: width=0.5 color=gray(0.7)
yaxis.label: Inwoners
#proc lineplot
xfield: 1
yfield: 2
linedetails: width=2 color=blue
pointsymbol: shape=circle style=open fillcolor=blue radius=0.01
numbers: color=purple
Waarna handmatig height="144" width="184"toegevoegd in de svg. |
| Date | 18 December 2006 (original upload date) |
| Source | Transferred from nl.wikipedia to Commons. |
| Author | Valhallasw at Dutch Wikipedia |
Licensing
[edit]
Valhallasw at Dutch Wikipedia, the copyright holder of this work, hereby publishes it under the following license:
This file is licensed under the Creative Commons Attribution 2.5 Netherlands license.
Attribution: Valhallasw at Dutch Wikipedia
- You are free:
- to share – to copy, distribute and transmit the work
- to remix – to adapt the work
- Under the following conditions:
- attribution – You must give appropriate credit, provide a link to the license, and indicate if changes were made. You may do so in any reasonable manner, but not in any way that suggests the licensor endorses you or your use.

Original upload log
[edit]
The original description page was here. All following user names refer to nl.wikipedia.
- 2006-12-18 12:17 Valhallasw 184×144×0 (3504 bytes)
- 2006-12-18 12:02 Valhallasw 256×256×0 (3475 bytes) #proc getdata data: 1971 898 1972 876 1973 878 1974 856 1975 838 1976 792 1977 760 #proc areadef rectangle: 1 1 2.6 2.3 xscaletype date yyyy xrange 1970 1978 yrange 0 1200 xaxis.stubs:
- 2006-12-18 11:50 Valhallasw 256×256×0 (3465 bytes) Ploticus-plot van de evolutie van het bevolkingsaantal van [[Beauvoorde]] Gebruikte code: <pre>#proc getdata data: 1971 898 1972 876 1973 878 1974 856 1975 838 1976 792 1977 760 #proc areadef x
- 2006-12-18 11:19 Valhallasw 256×256×0 (8045 bytes) Ploticus-plot van de evolutie van het bevolkingsaantal van [[Beauvoorde]] Gebruikte code: <pre>#proc getdata data: 1971 898 1972 876 1973 878 1974 856 1975 838 1976 792 1977 760 #proc areadef x
File history
Click on a date/time to view the file as it appeared at that time.
| Date/Time | Thumbnail | Dimensions | User | Comment | |
|---|---|---|---|---|---|
| current | 18:40, 13 February 2008 | | 184 × 144 (3 KB) | BotMultichill (talk | contribs) | {{BotMoveToCommons|nl.wikipedia}} {{Information |Description={{nl|Ploticus-plot van de evolutie van het bevolkingsaantal van nl:Beauvoorde Gebruikte code: <pre>#proc getdata data: 1971 898 1972 876 1973 878 1974 8 |
You cannot overwrite this file.
File usage on Commons
There are no pages that use this file.
File usage on other wikis
The following other wikis use this file:
- Usage on nl.wikipedia.org