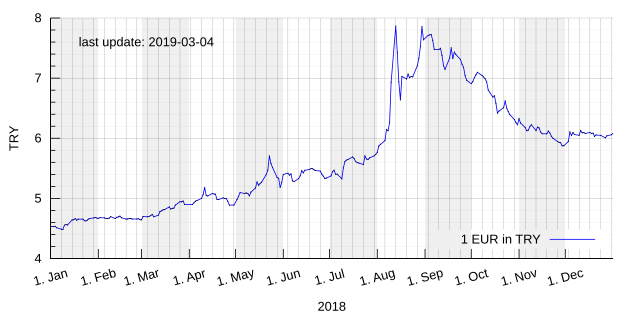
File:Euro exchange rate to TRY - Turkish Currency and Debt Crisis 2018.svg
Jump to navigation
Jump to search

Size of this PNG preview of this SVG file: 800 × 400 pixels. Other resolutions: 320 × 160 pixels | 640 × 320 pixels | 1,024 × 512 pixels | 1,280 × 640 pixels | 2,560 × 1,280 pixels.
Original file (SVG file, nominally 800 × 400 pixels, file size: 99 KB)
Captions
Captions
Add a one-line explanation of what this file represents
Summary[edit]
| Description | See Filename |
| Source | Own work |
| Author | Summer ... hier! (talk) 14:18, 2 September 2018 (UTC) |
| Other versions | file:Euro exchange rate to TRY.svg |
Licensing[edit]
I, the copyright holder of this work, hereby publish it under the following license:
| This file is made available under the Creative Commons CC0 1.0 Universal Public Domain Dedication. | |
| The person who associated a work with this deed has dedicated the work to the public domain by waiving all of their rights to the work worldwide under copyright law, including all related and neighboring rights, to the extent allowed by law. You can copy, modify, distribute and perform the work, even for commercial purposes, all without asking permission.
|
Gnuplot script to generate this plot[edit]
This plot was created with Gnuplot.
#!/usr/bin/env gnuplot
# based on code of [[User:Gorgo]]/[[:c:File:Euro exchange rate to TRY.svg]]

# gnuplot script for plotting eurofxref-hist.csv as obtained from
# http://www.ecb.int/stats/exchange/eurofxref/html/index.en.html
# Before runnig this script, download and unzip to working directory:
# https://www.ecb.europa.eu/stats/eurofxref/eurofxref-hist.zip

infile='eurofxref-hist.csv'
outfile='Euro_exchange_rate_to_TRY_-_Turkish_Currency_and_Debt_Crisis_2018.svg'

# Start und Ende ermitteln (z.Zt. nur für Consolenausagabe)
  stats infile every ::1   u (strptime("%Y-%m-%d",strcol(1))) nooutput
  print '     -----Stats-(Timestamp)----'
  print '     Start:          ', strftime("%d. %B %Y",STATS_min)
  print '     Ende:           ', strftime("%d. %B %Y",STATS_max)
  print '     --------------------------'
set label 'last update: ' . strftime("%Y-%m-%d",STATS_max) at graph 0.05, graph 0.9


#input
set timefmt "%Y-%m-%d"
set datafile missing 'N/A'
set datafile separator ','

#output
set key bottom right
set style data lines
set border 3              # Rahmen unten (Bit 1) und links (+ Bit 2)
unset grid                   # Gitterlinien verwenden
# Gitterlinienen per Hand setzen falls gewünscht
set style line 1 linetype rgb '#696969' linewidth 0.25 # Def. Major-grid
set style line 2 linetype rgb '#C9C9C9' linewidth 0.15 # def. Minor-grid
set grid noxtics nomxtics     # Keine Gitterlinen an der 1. X-Achse
set grid x2tics
set grid ytics mytics     # Gitterl. an der Y-Achse
set grid back             # Gitter im Hintergrund
set grid linestyle 1, linestyle 2 # Setzen des linestyle für Major u. Minor

# die Kalenderwochen-Markierung machen wir über x2 !!!
set xdata time
set x2data time
set format x  '1. %b'
set xtics ('') # leeren Str setzen damit per for-Schleife
               # addiert werden kann
do for [month_tic=1:12] {
  new_xtic = gprintf("2018-%02.0f-01", month_tic)
  # print 'Setze xtic bei: ' . new_xtic # Ausgabe für Tests
  set xtics add ( new_xtic )
}
if (GPVAL_VERSION >= 5.0) {
  set xtics rotate by +15 center offset 0,-0.5
} else {
  set xtics rotate by +15 center offset 0,-0.75
}
set format x2 ''
set xrange  ['2018-01-01':'2019-01-01']
set x2range ['2018-01-01':'2019-01-01']
set x2tics   '2018-01-01', 60 * 60 * 24 * 7
set x2tic scale 0
set xtics nomirror
unset mxtics
set xlabel '2018'


set  ylabel 'TRY'
# set y2label 'TRY'
set format y  '%.0f'
# set format y2 '%.0f'

set  ytics 1
set  mytics 5
set ytics nomirror

# Zebramuster
set style rect fillcolor lt -1 fillstyle solid 0.06 noborder
do for [i=1:12:2] {
  marker_start=sprintf("2018-%1.2d-01",i)
  marker_stop =sprintf("2018-%1.2d-01",i+1)
  print 'setze grauen Marker: ' . marker_start . "-" . marker_stop
  set object rectangle from marker_start,graph 0 to marker_stop, graph 1
}

## gnuplot for SVG - gnuplot 4.2 / Ubuntu 8.10
if (GPVAL_VERSION >= 5.0) {
  set term svg size 800,400 font "Arial,16"
} else {
  set term svg size 800,400 font "Arial,12"
}

set outp outfile
set style line 1 lt rgb 'blue' lw 1

#available currencies:
#first one is $2, second $3 and so on
#USD,JPY,BGN,CYP,CZK,DKK,EEK,GBP,HUF,LTL,LVL,MTL,PLN,ROL,RON,SEK,SIT,SKK,CHF,ISK,NOK,HRK,RUB,TRL,TRY,AUD,BRL,CAD,CNY,HKD,IDR,ILS,INR,KRW,MXN,MYR,NZD,PHP,SGD,THB,ZAR

plot \
  infile \
    usi 1:($26) axis x1y1 tit '1 EUR in TRY' lt rgb 'blue' lw 1,\
  infile \
    usi 1:($26) axis x1y1 notit w  p lc rgb 'black' lt 1 lw 1.5 pt 7 ps 0.1 \
File history
Click on a date/time to view the file as it appeared at that time.


You cannot overwrite this file.
File usage on Commons
There are no pages that use this file.
File usage on other wikis
The following other wikis use this file: