File:Einwohnerentwicklung von Waren (Müritz).svg
Jump to navigation
Jump to search

Size of this PNG preview of this SVG file: 800 × 400 pixels. Other resolutions: 320 × 160 pixels | 640 × 320 pixels | 1,024 × 512 pixels | 1,280 × 640 pixels | 2,560 × 1,280 pixels.
Original file (SVG file, nominally 800 × 400 pixels, file size: 19 KB)
Captions
Captions
Add a one-line explanation of what this file represents
Summary[edit]
.svg&action=edit§ion=1)
| Description |
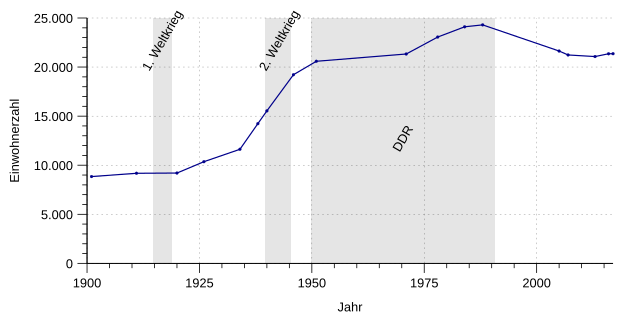
Deutsch: Einwohnerentwicklung von Waren (Müritz) |
| Source | Own work |
| Author | Summer ... hier! (talk) 14:13, 16 October 2017 (UTC) |
Licensing[edit]
.svg&action=edit§ion=2)
I, the copyright holder of this work, hereby publish it under the following license:
| This file is made available under the Creative Commons CC0 1.0 Universal Public Domain Dedication. | |
| The person who associated a work with this deed has dedicated the work to the public domain by waiving all of their rights to the work worldwide under copyright law, including all related and neighboring rights, to the extent allowed by law. You can copy, modify, distribute and perform the work, even for commercial purposes, all without asking permission.
|
Gnuplot script to generate this plot[edit]
.svg&action=edit§ion=3)
This plot was created with Gnuplot.
#!/usr/bin/gnuplot
# gnuplot

# Variablen - die wichtigsten Paramter dieser Grafik:
# (in der Regel wird es reichen fuer eine neue Grafik dieser Werte zu ändern)
my_data               = 'Einwohnerentwicklung_von_Waren_(Müritz).dat'
my_xrange_min         = '01.01.1900'
my_xrange_max         = '31.12.2016'
my_xtics_years        = '25'
my_mxtics             = '5'
my_yrange_min         = '0'
my_yrange_max         = '*'    # Nur hier ist '*' erlaubt und sinnvoll
my_ytics              = '5000'
my_ymtics             = '5'


# Allgemeines zu den Eingabedaten
set timefmt "%d.%m.%Y"     # Zeitangaben in TT.MM.YYYY
set datafile separator ";" # Spaltenseparator


# Allgemeines zur Ausgabe
unset key                  # als Standard keine Legende
set style data lines       # wird bei 'plot' überschrieben
set style fill transparent solid 0.4 # ebenfalls bei 'plot' überschrieben
set grid                   # Gitterlinien verwenden
set border 3               # Rahmen unten (Bit 1) und links (+ Bit 2)


# Bereiche/Format/etc X-Achse
set xdata time             # X-Achse als Zeitachse
set xlabel 'Jahr'          # Beschriftung X-Achse
set xlabel offset 0, 0.75  # Schrift etwas höher
set xrange [ my_xrange_min : my_xrange_max]
                           # Wertebreich der X-Achse
set xtics '01.01.1000', 60 * 60 * 24 * 365.25 * my_xtics_years
                           # xtics in Sekunden
                           # der Beginn (Wert vor dem Komma) der X-Einteilung
                           # kann außerhalb xrange liegen
set xtics offset  0, 0.5   # Beschritung näher an die X-Achse
set mxtics 5               # Skalenstriche
set xtics nomirror         # Nur unten Skalieren
set format x '%Y'          # Beschriftungsformat JJJJ
set xtics  out             # Skal. aussen damit sich nicht von Grafik
                           # überschr. wird


# Bereiche/Format/etc Y-Achse
set ylabel 'Einwohnerzahl' offset 2 # Abstand Achse/Label
# Untere Begrenzung des Bereichs der Y-Achse
set yrange [ my_yrange_min : ]
# Obere  Begrenzung des Bereichs der Y-Achse
# wir Testen ob der Wert der Var.  my_yrange_max ein '*' ist und reagieren
# entsprechend weil der '*' sich nicht direkt via Var. setzen lässt.
if ( ( my_yrange_max eq '*' )) set yrange [ : *             ]
if (!( my_yrange_max eq '*' )) set yrange [ : my_yrange_max ]
set ytics my_ytics         # Anzahl der kleinen Teilstriche
set ytics offset 0.5       # Schrift etwas nach rechts
set ytics nomirror         # oben keine Teilstriche
set decimalsign locale "de_DE.utf8" # Stelle Input und Output auf "," um
                           # set decimalsign ',' würde nur Output umstellen,
set format y  "%'.0f"      # Ausgabeformat
set mytics my_ymtics       # Unterscalierung
set ytics  out             # Skal. aussen da sie sonst von Grafik
                           # überschr. wird


#### Markierungsbalken für die beiden Weltkriege etc.
# Die set-Befehle ggf. auskommentieren
# Attribute für Markierungsbalken
set style rect fillcolor lt -1 fillstyle solid 0.1 noborder
#
# == Dreißigjähriger Krieg
 set obj rect from '23.05.1618', graph 0 to '24.10.1648' , graph 1
 set label "Dreißigjähriger Krieg" at '30.06.1633', graph 0.8 rotate by +60 center
# == Siebenjähriger Krieg
#set obj rect from '29.08.1756', graph 0 to '21.09.1762' , graph 1
#set label "Siebenjähriger Krieg"  at '30.06.1759', graph 0.8 rotate by +60 center
# == Befreiungskriege
#set obj rect from '26.02.1813', graph 0 to '20.11.1815' , graph 1
#set label "Befreiungskriege"      at '30.06.1814', graph 0.8 rotate by +60 center
# == 1. Weltkrieg
 set obj rect from '28.07.1914', graph 0 to '11.11.1918' , graph 1
 set label "1. Weltkrieg"          at '30.06.1916', graph 0.9 rotate by +60 center
# ==  2. Weltkrieg
 set obj rect from '01.09.1939', graph 0 to '04.05.1945' , graph 1
 set label "2. Weltkrieg"          at '30.06.1942', graph 0.9 rotate by +60 center
# == Dädärä
 set obj rect from '07.10.1949', graph 0 to '03.10.1990' , graph 1
 set label "DDR"                   at '01.01.1970', graph 0.5 rotate by +60 center


# Ausgabeformat: Wir erzeugen SVG
# Die Ausgabedaten leiten wir bei UNIX in eine Pipe und sind so bei Namen der
# Ausgabedatei flexibel (Aufruf: Progname.plt > Ausgabe-svg)
# Windowsbenutzer, die mit Pipes nicht umgehen könnten, sollten hier hier das
# folgende 'set output ...' auskommentieren und den Dateinamen ggf. ersetzen.
# set output 'Einwohnerentwicklung_von_Waren_(Müritz).svg'
set term svg size 800,400 font "Arial,16"
# Die Parameter von 'set term' sind so gewählt, das man in Wikipedia bei einer
# Einbindung [[Datei:Meine_Grafik.svg|mini|400px|Text]] noch Schrift/Details
# erkennen kann.


# Erzeugen der Ausgabe
plot \
   my_data using 1:2 with linespoints linecolor 'dark-blue'   linetype 1 linewidth 1.5 pointtype 7 pointsize 0.30,\
Daten[edit]
.svg&action=edit§ion=4)
Die folgenden Daten bitte in eine Textdatei unter dem Namen "Einwohnerentwicklung_von_Waren_(Müritz).dat" abspeichern und ins gleiche Verzeichnis wie das GnuPlot-Script ablegen.
Update der Daten und Überschreiben der Grafik ausdrücklich erwünscht.
#
# Quelle:
# https://de.wikipedia.org/wiki/Waren_(M%C3%BCritz)#Einwohnerentwicklung_.281900.E2.80.932015.29
#
31.12.1900;8848
31.12.1910;9182
31.12.1919;9203
31.12.1925;10363
31.12.1933;11622
31.12.1937;14236
31.12.1939;15538
01.12.1945;19218
31.12.1950;20594
#
31.12.1970;21332
31.12.1977;23057
31.12.1983;24101
31.12.1987;24300
31.12.2004;21637
31.12.2006;21236
31.12.2012;21074
31.12.2015;21354
31.12.2016;21367
EOF
File history
Click on a date/time to view the file as it appeared at that time.
| Date/Time | Thumbnail | Dimensions | User | Comment | |
|---|---|---|---|---|---|
| current | 21:39, 7 February 2018 | | 800 × 400 (19 KB) | Summer ... hier! (talk | contribs) | Text verschoben |
| 21:37, 7 February 2018 |  | 800 × 400 (19 KB) | Summer ... hier! (talk | contribs) | +DDR-Marker | |
| 21:33, 7 February 2018 |  | 800 × 400 (19 KB) | Summer ... hier! (talk | contribs) | +2016 | |
| 14:13, 16 October 2017 |  | 800 × 400 (28 KB) | Summer ... hier! (talk | contribs) | {{Information |Description = {{de|Einwohnerentwicklung von Waren (Müritz)}} |Source = {{own}} |Author = ~~~~ |Date = }} == {{int:license-header}} == {{self|Cc-zero}} == Gnuplot script to generate this plot == {{gnuplot}... |
You cannot overwrite this file.
File usage on Commons
There are no pages that use this file.
.svg&oldid=746016850)