File:Einwohnerentwicklung von Leipzig - 1800-.svg
Jump to navigation
Jump to search

Size of this PNG preview of this SVG file: 800 × 400 pixels. Other resolutions: 320 × 160 pixels | 640 × 320 pixels | 1,024 × 512 pixels | 1,280 × 640 pixels | 2,560 × 1,280 pixels.
Original file (SVG file, nominally 800 × 400 pixels, file size: 30 KB)
Captions
Captions
Add a one-line explanation of what this file represents
Summary[edit]
| Description |
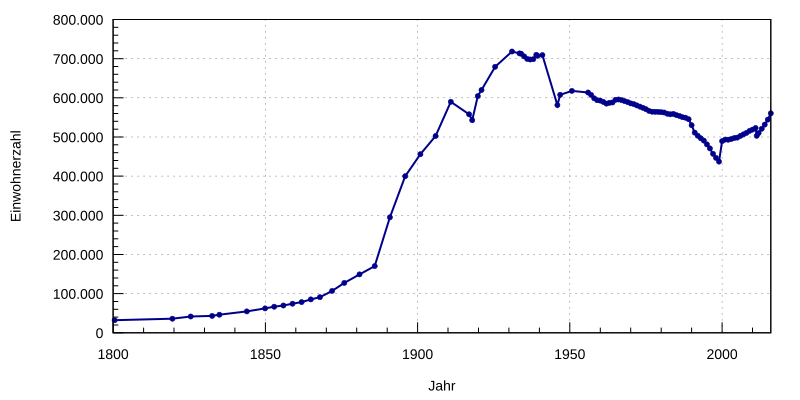
Deutsch: Einwohnerentwicklung von leipzig |
| Source | Own work |
| Author | Summer ... hier! 13:39, 6 September 2017 (UTC) |
| Other versions |
 |
| SVG development | This plot was created with Gnuplot. This plot uses embedded text that can be easily translated using a text editor. |
Licensing[edit]
I, the copyright holder of this work, hereby publish it under the following license:
| This file is made available under the Creative Commons CC0 1.0 Universal Public Domain Dedication. | |
| The person who associated a work with this deed has dedicated the work to the public domain by waiving all of their rights to the work worldwide under copyright law, including all related and neighboring rights, to the extent allowed by law. You can copy, modify, distribute and perform the work, even for commercial purposes, all without asking permission.
|
Gnuplot script to generate this plot[edit]
Source code
Gnuplot code
#!/usr/bin/gnuplot
# gnuplot


# Allgemeines zu den Eingabedaten
set timefmt "%d.%m.%Y"     # Zeitangaben in TT.MM.YYYY
set datafile separator ";" # Spaltenseparator


# Allgemeines zur Ausgabe
unset key
set style data lines
set style fill transparent solid 0.4
set grid


# Bereiche/Format/etc X-Achse
set xdata time
set xlabel 'Jahr'
set xrange ['01.01.1800':'31.12.2015']
set xtics '01.01.1100', 60 * 60 * 24 * 365.25 * 50
                      #  xtics in Sekunden
                      # der Beginn der X-Einteilung kann außerhalb xrange
                      # liegen
set mxtics 5
set format x '%Y'     # Beschriftungsformat JJJJ
set xtics nomirror    # Nur unten Skalieren


# Bereiche/Format/etc Y-Achse
set ylabel 'Einwohnerzahl'
set yrange [0:]
set ytics 100000
set decimalsign locale "de_DE.utf8"
set decimal     locale "de_DE.utf8"
set format      y  "%'.0f"  # Ausgabeformat
set mytics      5
set ytics nomirror


# Ausgabeformat: Wir erzeugen SVG
# Die Ausgabedaten leiten wir in eine Pipe und sind so bei Namen der
# Ausgabedatei flexibel (Aufruf: Progname.plt > Ausgabe-svg)
set term svg size 800,400 font "Arial,14"
# keine "set output '<Dateiname>'" Angabe


# Erzeugen der Ausgabe
plot \
  './Einwohnerentwicklung_von_Leipzig.cvs'\
    using 1:($2) axes x1y1 with linespoints lc 'dark-blue'  lt 1 lw 2 pt 7 ps 0.5

#
# In der Dateibeschreibung von [[File:Einwohnerentwicklung_von_Leipzig.svg]]
# sind die zum Erstellen dieser Grafik notwenigen Daten eingestellt.
# Bitte aus den Daten die Datei 'Einwohnerentwicklung_von_Leipzig.cvs'
# erzeugen und in gleiche Verz. wie diese GnuPlot-Quelle ablegen.
File history
Click on a date/time to view the file as it appeared at that time.
| Date/Time | Thumbnail | Dimensions | User | Comment | |
|---|---|---|---|---|---|
| current | 13:39, 6 September 2017 | | 800 × 400 (30 KB) | Summer ... hier! (talk | contribs) | {{Information |Description = {{de|Einwohnerentwicklung von leipzig}} |Source = {{own}} |Author = ~~~~ |Date = {{date}} |Permission = |Other_versions = thumb }} == {{int:lic... |
You cannot overwrite this file.
File usage on Commons
There are no pages that use this file.