File:Einwohnerentwicklung von Lübeck (hochauflösend).svg
Jump to navigation
Jump to search

Size of this PNG preview of this SVG file: 800 × 400 pixels. Other resolutions: 320 × 160 pixels | 640 × 320 pixels | 1,024 × 512 pixels | 1,280 × 640 pixels | 2,560 × 1,280 pixels | 1,600 × 800 pixels.
Original file (SVG file, nominally 1,600 × 800 pixels, file size: 72 KB)
Captions
Captions
Add a one-line explanation of what this file represents
Summary[edit]
.svg&action=edit§ion=1)
| Description |
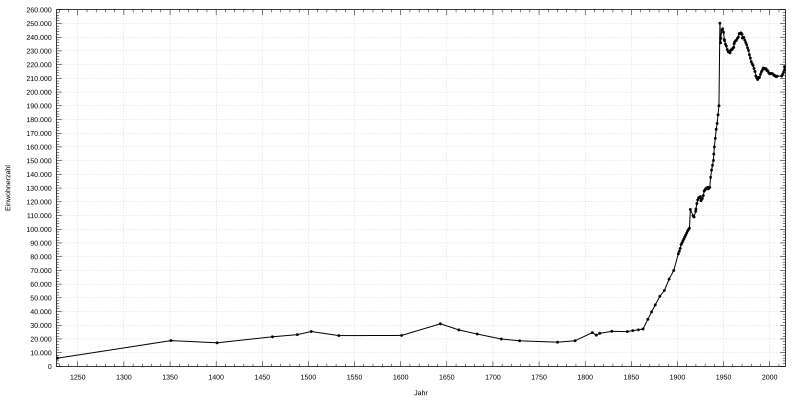
Deutsch: Einwohnerentwicklung von |
| Source | Own work |
| Author | Summer ... hier! (talk) |
Licensing[edit]
.svg&action=edit§ion=2)
I, the copyright holder of this work, hereby publish it under the following license:
| This file is made available under the Creative Commons CC0 1.0 Universal Public Domain Dedication. | |
| The person who associated a work with this deed has dedicated the work to the public domain by waiving all of their rights to the work worldwide under copyright law, including all related and neighboring rights, to the extent allowed by law. You can copy, modify, distribute and perform the work, even for commercial purposes, all without asking permission.
|
Gnuplot script to generate this plot[edit]
.svg&action=edit§ion=3)
W3C-validity not checked.
#!/usr/bin/gnuplot
# gnuplot


# Allgemeines zu den Eingabedaten
set timefmt "%d.%m.%Y"     # Zeitangaben in TT.MM.YYYY
set datafile separator ";" # Spaltenseparator


# Allgemeines zur Ausgabe
unset key
set style data lines
set style fill transparent solid 0.4
set grid


# Bereiche/Format/etc X-Achse
set xdata time
set xlabel 'Jahr'
set xrange ['01.01.1227':'31.12.2016']
set xtics '01.01.1200', 60 * 60 * 24 * 365.25 * 50
                      #  xtics in Sekunden
                      # der Beginn der X-Einteilung kann außerhalb xrange
                      # liegen
set mxtics 5
set format x '%Y'     # Beschriftungsformat JJJJ


# Bereiche/Format/etc Y-Achse
set ylabel 'Einwohnerzahl'
set yrange [0:]
set ytics 10000
set decimalsign locale "de_DE.utf8"
set decimal     locale "de_DE.utf8"
set format y  "%'.0f"  # Ausgabeformat
set mytics 5


# Ausgabeformat: Wir erzeugen SVG
# Die Ausgabedaten leiten wir in eine Pipe und sind so bei Namen der
# Ausgabedatei flexibel (Aufruf: Progname.plt > Ausgabe-svg)
set term svg size 1600,800 font "Arial,14"
# keine "set output '<Dateiname>'" Angabe


# Erzeugen der Ausgabe
plot '-' using 1:($2) with linespoints linecolor 'black'  linetype 1 linewidth 2 pointtype 7 pointsize 0.5,\

# Quelle:
# https://de.wikipedia.org/wiki/Einwohnerentwicklung_von_L%C3%BCbeck
31.12.1227;6000
31.12.1350;18800
31.12.1400;17200
31.12.1460;21568
31.12.1487;23157
31.12.1502;25444
31.12.1532;22452
31.12.1600;22570
31.12.1642;31068
31.12.1662;26597
31.12.1682;23596
31.12.1708;19978
#
31.12.1728;18667
31.12.1769;17644
31.12.1788;18693
01.10.1807;24631
01.01.1812;22772
01.11.1815;24143
01.11.1828;25600
01.09.1845;25360
01.09.1851;26098
01.09.1857;26672
01.09.1862;27249
03.12.1867;34346
###
01.12.1871;39743
01.12.1875;44799
01.12.1880;51055
01.12.1885;55399
01.12.1890;63590
02.12.1895;69874
01.12.1900;82098
31.12.1901;83961
31.12.1902;85976
31.12.1903;88872
31.12.1904;90003
01.12.1905;91541
31.12.1906;92983
31.12.1907;94406
31.12.1908;95829
31.12.1909;97252
01.12.1910;98656
31.12.1911;99790
#;;
31.12.1912;100791
31.12.1913;114446
01.12.1916;109897
05.12.1917;108956
08.10.1919;113071
31.12.1919;114656
31.12.1920;118709
31.12.1921;121443
31.12.1922;123064
31.12.1923;122785
31.12.1924;123796
16.06.1925;120788
31.12.1925;121725
31.12.1926;122397
31.12.1927;124542
31.12.1928;127843
31.12.1929;128743
31.12.1930;129842
#;;
31.12.1931;129995
31.12.1932;130481
16.06.1933;129427
31.12.1933;129978
31.12.1934;130467
31.12.1935;137812
31.12.1936;143113
31.12.1937;146654
31.12.1938;150144
17.05.1939;154811
31.12.1939;160015
31.12.1940;166300
31.12.1941;172809
31.12.1942;177143
31.12.1943;183403
31.12.1944;190031
###
31.12.1945;250181
29.10.1946;235923
31.12.1946;239194
31.12.1947;245111
31.12.1948;246058
31.12.1949;243548
13.09.1950;238276
31.12.1950;237548
31.12.1951;234960
31.12.1952;233554
31.12.1953;230974
31.12.1954;229345
31.12.1955;229132
25.09.1956;229554
31.12.1956;228670
31.12.1957;230708
31.12.1958;230840
#;;
31.12.1959;231827
31.12.1960;232673
06.06.1961;235200
31.12.1961;236477
31.12.1962;237322
31.12.1963;237856
31.12.1964;239171
31.12.1965;240015
31.12.1966;242616
31.12.1967;242731
31.12.1968;243121
31.12.1969;241982
27.05.1970;239339
31.12.1970;239657
31.12.1971;239761
31.12.1972;237776
31.12.1973;236047
#;;
31.12.1974;234510
31.12.1975;232270
31.12.1976;230407
31.12.1977;227184
31.12.1978;224790
31.12.1979;222120
31.12.1980;220588
31.12.1981;219403
31.12.1982;217225
31.12.1983;214980
31.12.1984;211707
31.12.1985;210318
31.12.1986;209159
25.05.1987;210497
31.12.1987;210356
31.12.1988;210681
31.12.1989;212932
###
31.12.1990;214758
31.12.1991;215999
31.12.1992;217500
31.12.1993;217269
31.12.1994;216854
31.12.1995;216986
31.12.1996;215673
31.12.1997;215376
31.12.1998;214017
31.12.1999;213326
31.12.2000;213399
#;;
31.12.2001;213496
31.12.2002;213301
31.12.2003;212754
31.12.2004;211874
31.12.2005;211825
31.12.2006;211213
31.12.2007;211541
31.12.2012;211713
31.12.2013;212958
31.12.2014;214420
31.12.2015;216253
26.01.2016;218523
EOF
File history
Click on a date/time to view the file as it appeared at that time.
| Date/Time | Thumbnail | Dimensions | User | Comment | |
|---|---|---|---|---|---|
| current | 13:21, 29 August 2017 | | 1,600 × 800 (72 KB) | Summer ... hier! (talk | contribs) | {{Information |Description = {{de|Einwohnerentwicklung von }} |Source = {{own}} |Author = ~~~ |Date = {{date}} }} == {{int:license-header}} == {{self|Cc-zero}} == Gnuplot script to generate this plot == {{gnuplot}}{{Valid... |
You cannot overwrite this file.
File usage on Commons
There are no pages that use this file.
.svg&oldid=746340125)