File:Einwohnerentwicklung von Hannover - Prognose 2006–2025.svg
Jump to navigation
Jump to search

Size of this PNG preview of this SVG file: 800 × 400 pixels. Other resolutions: 320 × 160 pixels | 640 × 320 pixels | 1,024 × 512 pixels | 1,280 × 640 pixels | 2,560 × 1,280 pixels.
Original file (SVG file, nominally 800 × 400 pixels, file size: 24 KB)
Captions
Captions
Add a one-line explanation of what this file represents
Summary[edit]
| Description |
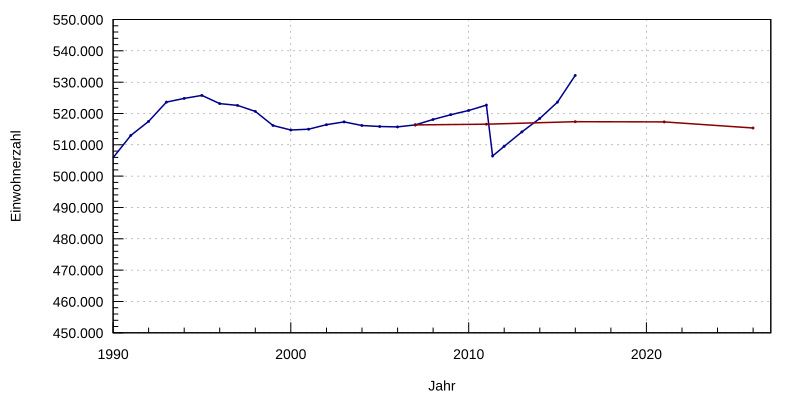
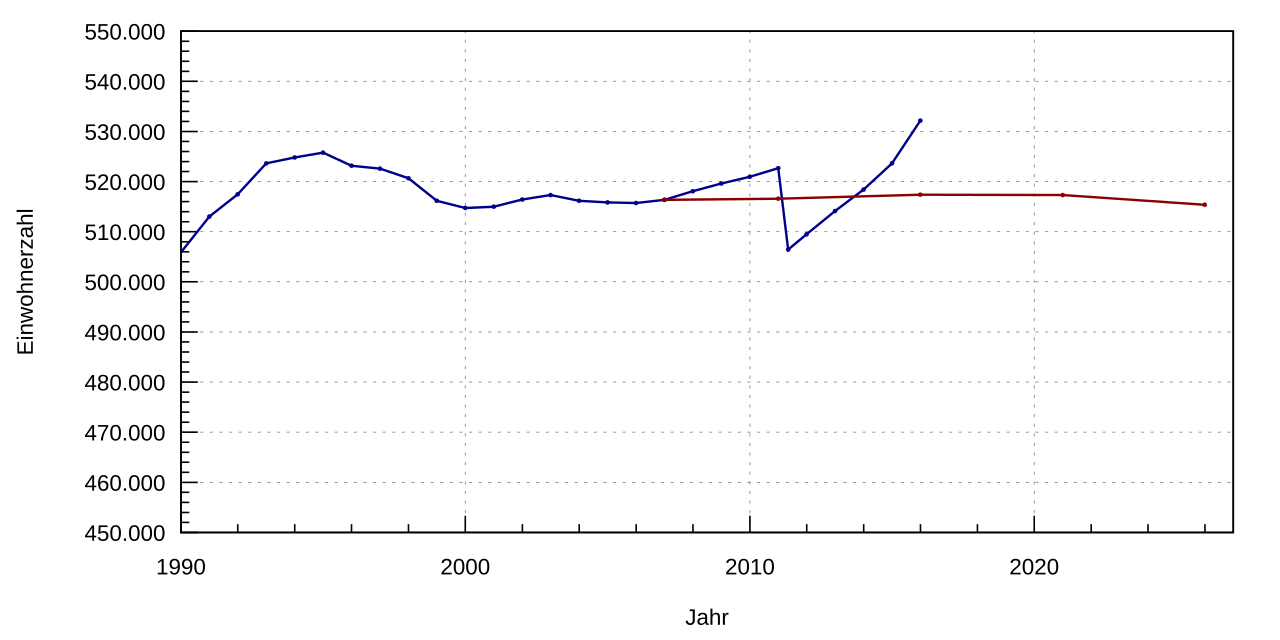
Deutsch: Einwohnerentwicklung von Hannover mit Prognose von 2006 bis 2025 |
| Source | Own work |
| Author | Summer ... hier! (talk) 11:58, 15 September 2017 (UTC) |
Licensing[edit]
I, the copyright holder of this work, hereby publish it under the following license:
| This file is made available under the Creative Commons CC0 1.0 Universal Public Domain Dedication. | |
| The person who associated a work with this deed has dedicated the work to the public domain by waiving all of their rights to the work worldwide under copyright law, including all related and neighboring rights, to the extent allowed by law. You can copy, modify, distribute and perform the work, even for commercial purposes, all without asking permission.
|
Gnuplot script to generate this plot[edit]
W3C-validity not checked.
#!/usr/bin/gnuplot
# gnuplot


# Allgemeines zu den Eingabedaten
set timefmt "%d.%m.%Y"     # Zeitangaben in TT.MM.YYYY
set datafile separator ";" # Spaltenseparator


# Allgemeines zur Ausgabe
unset key
set style data lines
set style fill transparent solid 0.4
set grid


# Bereiche/Format/etc X-Achse
set xdata time
set xlabel 'Jahr'
set xrange ['01.01.1990':'31.12.2026']
set xtics '01.01.1000', 60 * 60 * 24 * 365.25 * 10
                      #  xtics in Sekunden
                      # der Beginn der X-Einteilung kann außerhalb xrange
                      # liegen
set mxtics 5          # Unterteilung der Skalierung
set xtics nomirror    # Nur unten Skalieren
set format x '%Y'     # Beschriftungsformat JJJJ


# Bereiche/Format/etc Y-Achse
set ylabel 'Einwohnerzahl'
set yrange [450000:550000]
set ytics 10000
set mytics 5
set ytics nomirror
set decimalsign locale "de_DE.utf8"
set decimal     locale "de_DE.utf8"
set format y  "%'.0f" # Ausgabeformat


# Ausgabeformat: Wir erzeugen SVG
# Die Ausgabedaten leiten wir in eine Pipe und sind so bei Namen der
# Ausgabedatei flexibel (Aufruf: Progname.plt > Ausgabe-svg)
set term svg size 800,400 font "Arial,14"  dashed
# set termoption dashed # sollte bei Probl. m. gestrichelten L. gesetzt werden
# keine "set output '<Dateiname>'" Angabe


# Erzeugen der Ausgabe
plot \
  '-' using 1:($2) with linespoints linecolor 'dark-blue'   linetype 1 linewidth 1.5 pointtype 7 pointsize 0.25,\
  '-' using 1:($2) with linespoints linecolor 'dark-red'    linetype 1 linewidth 1.5 pointtype 7 pointsize 0.25


# Quellen:
#
# Daten für reale Entwicklung aus
# [[:File:Hannover population.svg]] übernommen.
# Eventuelle Korrekturen bitte dort nachziehen.
#
# Daten für Prognose aus
# https://de.wikipedia.org/wiki/Einwohnerentwicklung_von_Hannover#Bev.C3.B6lkerungsprognose
# übernommen.
#
#
# reale Entwicklung:
31.12.1989;505872
31.12.1990;513010
31.12.1991;517476
31.12.1992;523627
31.12.1993;524823
31.12.1994;525763
31.12.1995;523147
31.12.1996;522574
31.12.1997;520670
31.12.1998;516157
31.12.1999;514718
31.12.2000;515001
31.12.2001;516415
31.12.2002;517310
31.12.2003;516160
31.12.2004;515841
31.12.2005;515729
31.12.2006;516343
31.12.2007;518069
31.12.2008;519619
31.12.2009;520966
31.12.2010;522686
09.05.2011;506416
31.12.2011;509485
31.12.2012;514137
31.12.2013;518386
31.12.2014;523642
31.12.2015;532163
EOF
#
#
# Daten für Prognose
31.12.2006;516343
31.12.2010;516594
31.12.2015;517385
31.12.2020;517301
31.12.2025;515358
EOF
File history
Click on a date/time to view the file as it appeared at that time.
| Date/Time | Thumbnail | Dimensions | User | Comment | |
|---|---|---|---|---|---|
| current | 11:58, 15 September 2017 | | 800 × 400 (24 KB) | Summer ... hier! (talk | contribs) | {{Information |Description = {{de|Einwohnerentwicklung von Hannover mit Prognose von 2006 bis 2025}} |Source = {{own}} |Author = ~~~~ |Date = }} == {{int:license-header}} == {{self|Cc-zero}} == Gnuplot script to generate... |
You cannot overwrite this file.
File usage on Commons
There are no pages that use this file.