File:EEMS of Britain and Ireland.png
Jump to navigation
Jump to search

Size of this preview: 566 × 600 pixels. Other resolutions: 226 × 240 pixels | 453 × 480 pixels | 725 × 768 pixels | 1,208 × 1,280 pixels.
Original file (1,208 × 1,280 pixels, file size: 715 KB, MIME type: image/png)
Captions
Captions
Add a one-line explanation of what this file represents
Summary[edit]
| Description |
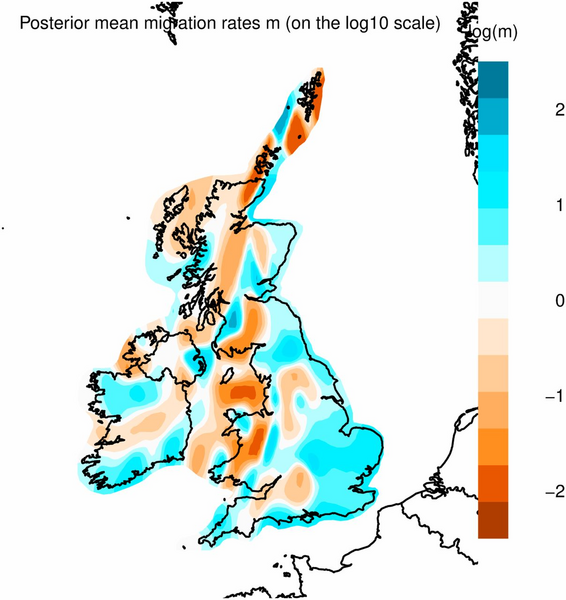
English: EEMS of Britain and Ireland. Shown are the posterior mean migration rates of 10 independent EEMS analytical runs (m, on a log10 scale). The image was produced using R and the rEEMSplots package, and the administrative boundaries and outline were sourced from the R package rworldxtra. Many strong barriers to migration can be seen in orange shades in Scotland, Wales, and Ireland. |
| Date | First published: September 3, 2019 |
| Source | Gilbert E, O'Reilly S, Merrigan M, et al. The genetic landscape of Scotland and the Isles. Proc Natl Acad Sci U S A. 2019;116(38):19064–19070. https://doi.org/10.1073/pnas.1904761116 |
| Author | Edmund Gilbert, Seamus O’Reilly, Michael Merrigan, Darren McGettigan, Veronique Vitart, Peter K. Joshi, David W. Clark, Harry Campbell, Caroline Hayward, Susan M. Ring, Jean Golding, Stephanie Goodfellow, Pau Navarro, Shona M. Kerr, Carmen Amador, Archie Campbell, Chris S. Haley, David J. Porteous, Gianpiero L. Cavalleri, and James F. Wilson |
| Other versions |
|


Licensing[edit]
This file is licensed under the Creative Commons Attribution 4.0 International license.
- You are free:
- to share – to copy, distribute and transmit the work
- to remix – to adapt the work
- Under the following conditions:
- attribution – You must give appropriate credit, provide a link to the license, and indicate if changes were made. You may do so in any reasonable manner, but not in any way that suggests the licensor endorses you or your use.
File history
Click on a date/time to view the file as it appeared at that time.
| Date/Time | Thumbnail | Dimensions | User | Comment | |
|---|---|---|---|---|---|
| current | 13:21, 22 December 2019 | | 1,208 × 1,280 (715 KB) | Was a bee (talk | contribs) | {{Information |Description={{en|1=EEMS of Britain and Ireland. Shown are the posterior mean migration rates of 10 independent EEMS analytical runs (m, on a log10 scale). The image was produced using R and the rEEMSplots package, and the administrative boundaries and outline were sourced from the R package rworldxtra. Many strong barriers to migration can be seen in orange shades in Scotland, Wales, and Ireland.}} |Source=Gilbert E, O'Reilly S, Merrigan M, et al. The genetic landscape of Scotl... |
You cannot overwrite this file.
File usage on Commons
The following 3 pages use this file: