File:Distribution of citances returned by signal or filter term queries.jpg
Jump to navigation
Jump to search

Size of this preview: 665 × 600 pixels. Other resolutions: 266 × 240 pixels | 532 × 480 pixels | 852 × 768 pixels | 1,136 × 1,024 pixels | 2,271 × 2,048 pixels | 5,051 × 4,555 pixels.
Original file (5,051 × 4,555 pixels, file size: 2.2 MB, MIME type: image/jpeg)
Captions
Captions
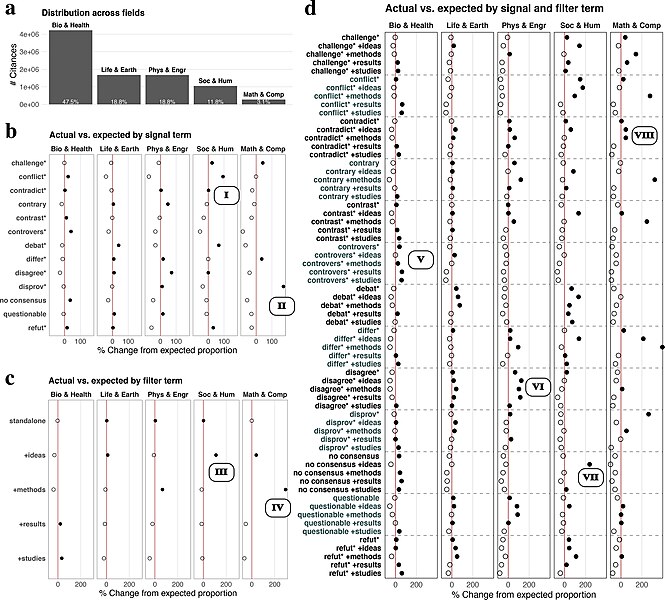
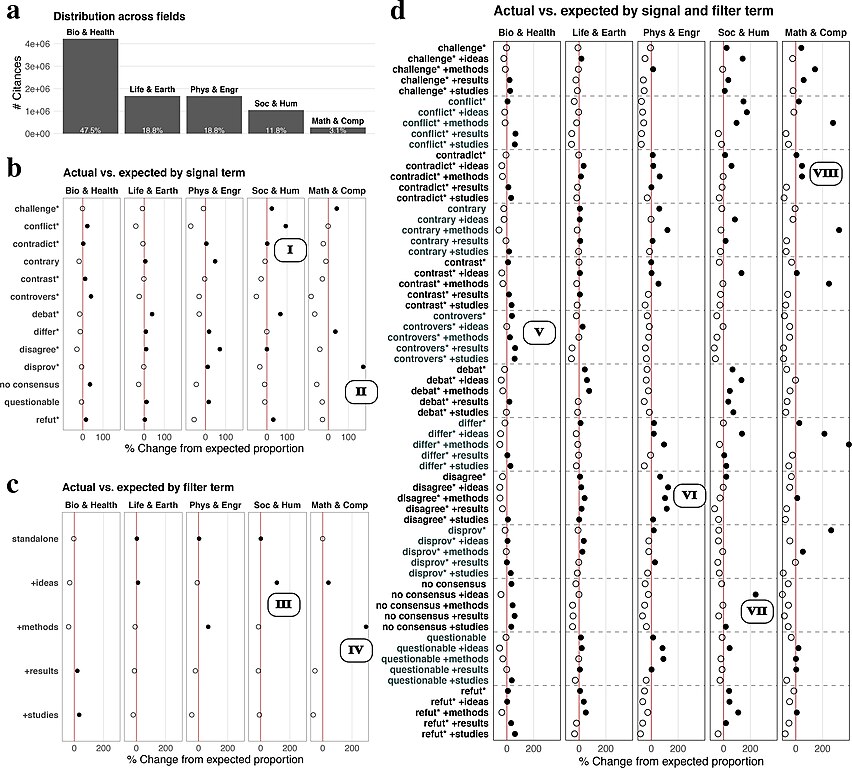
From the study "Meta-Research: Investigating disagreement in the scientific literature"
Summary[edit]
| Description |
English: "Callouts (I, II, …, VIII) map to examples in Table S3. a. Distribution of all disagreement citances appearing in papers across five fields: Biomedical and Health Sciences, Life and Earth Sciences, Physical Sciences and Engineering, Social Sciences and Humanities, and Math and Computer Science. b–d. Percentage change between the actual number of citances per field and signal/filter term combination compared to the expected given the disciplinary distribution (from a). The red line corresponds to 0 percent increase between the actual and expected. White dots indicate that the citances for that signal/filter term are under-represented (lower than expected, ratio less than zero), whereas black dots indicate that citances are over-represented (more than expected). Shown aggregated across signal terms (b), filter terms (c), and for all signal/filter term combinations (d)." |
| Date | |
| Source | https://elifesciences.org/articles/72737/figures#content |
| Author | Authors of the study: Wout S Lamers, Kevin Boyack, Vincent Larivière, Cassidy R Sugimoto, Nees Jan van Eck, Ludo Waltman, Dakota Murray |
Licensing[edit]
This file is licensed under the Creative Commons Attribution 4.0 International license.
- You are free:
- to share – to copy, distribute and transmit the work
- to remix – to adapt the work
- Under the following conditions:
- attribution – You must give appropriate credit, provide a link to the license, and indicate if changes were made. You may do so in any reasonable manner, but not in any way that suggests the licensor endorses you or your use.
File history
Click on a date/time to view the file as it appeared at that time.
| Date/Time | Thumbnail | Dimensions | User | Comment | |
|---|---|---|---|---|---|
| current | 22:43, 27 January 2023 | | 5,051 × 4,555 (2.2 MB) | Prototyperspective (talk | contribs) | Uploaded a work by Authors of the study: Wout S Lamers, Kevin Boyack, Vincent Larivière, Cassidy R Sugimoto, Nees Jan van Eck, Ludo Waltman, Dakota Murray from https://elifesciences.org/articles/72737/figures#content with UploadWizard |
You cannot overwrite this file.
File usage on Commons
There are no pages that use this file.