File:Delta T 1657-2022.svg
From Wikimedia Commons, the free media repository
Jump to navigation
Jump to search

Size of this PNG preview of this SVG file: 640 × 480 pixels. Other resolutions: 320 × 240 pixels | 1,024 × 768 pixels | 1,280 × 960 pixels | 2,560 × 1,920 pixels.
Original file (SVG file, nominally 640 × 480 pixels, file size: 33 KB)
File information
Structured data
Captions
Captions
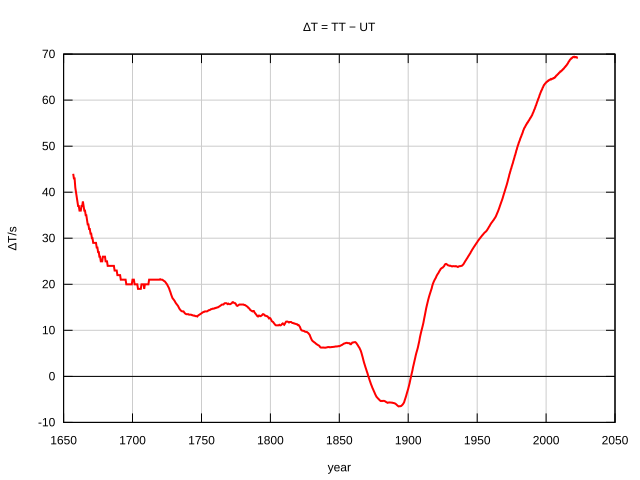
Plot of ∆T = TT − UT for the years 1657–2023.000
Plot von ∆T = TT − UT für die Jahre 1657–2023,000
Contents
Summary[edit]
| DescriptionDelta T 1657-2022.svg |
Deutsch: Plot von ∆T = TT − UT für die Jahre 1657–2023,000, wo TT die de:Terrestrische Zeit and UT die de:Universal Time ist. Er kombiniert Daten aus historic_deltat.data (1657 – 1973,000) und deltat.data (1973-02-01 – 2023-01-01). Die Werte bis 1973 stammen aus einer Arbeit von McCarthy und Babcock von 1986 (s. readme).
English: Plot of ∆T = TT − UT for the years 1657–2023.000, where TT is en:Terrestrial Time and UT is en:Universal Time. It combines data from historic_deltat.data (1657 – 1973.000) and deltat.data (1973-02-01 – 2023-01-01). The values until 1973 are from a paper of McCarthy and Babcock from 1986 (cf. readme). |
| Date | 2022-04-07, updated 2023-04-21 |
| Source |
Own work based on: |
| Author | PaulSch |
| SVG development InfoField | This diagram was created with Gnuplot. This plot uses embedded text that can be easily translated using a text editor. |
Bash code
#!/bin/sh

# Generate file hist.data (with columns year and ΔT).

# Get data from web
wget https://maia.usno.navy.mil/ser7/historic_deltat.data  # 1657.0 - 1984.5
wget https://maia.usno.navy.mil/ser7/deltat.data           # 1973-02-01 onward

# Prepare data for 1657.000 to 1973.000
awk '
    BEGIN { getline; getline; }
    { print $1 "\t" $2; }
    $1 == 1973 { exit; }
' < historic_deltat.data > hist.data

# Append data for 1973-02-01 to 2023-01-01
awk '
    {   "date +%j --date=" $1 "-" $2 "-" $3 |getline day;  # 001, …, 366
        "date +%j --date=" $1 "-12-31"      |getline yLen; # 365 or 366
        printf("%0.3f\t%s\n", $1 + ((day - 1)/yLen), $4);
    }
    $1 == 2023 { exit; }
' < deltat.data >> hist.data
Gnuplot code
#!/usr/bin/env gnuplot

# Plot data from hist.data.

set terminal svg size 640, 480 name "Delta_T"
set output 'Delta_T_1657-2022.svg'
set title "∆T = TT − UT"
set xlabel "year"
set ylabel "∆T/s"
set grid linetype 1 linecolor rgb "#cccccc"
unset key
set style data lines
set style line 1 linetype 1 linewidth 2
set style increment user
set xzeroaxis linetype 2 linecolor rgb "black"

plot 'hist.data' linetype rgb "#FF0000"
Licensing[edit]
I, the copyright holder of this work, hereby publish it under the following license:
This file is licensed under the Creative Commons Attribution-Share Alike 4.0 International license.
- You are free:
- to share – to copy, distribute and transmit the work
- to remix – to adapt the work
- Under the following conditions:
- attribution – You must give appropriate credit, provide a link to the license, and indicate if changes were made. You may do so in any reasonable manner, but not in any way that suggests the licensor endorses you or your use.
- share alike – If you remix, transform, or build upon the material, you must distribute your contributions under the same or compatible license as the original.
File history
Click on a date/time to view the file as it appeared at that time.
| Date/Time | Thumbnail | Dimensions | User | Comment | |
|---|---|---|---|---|---|
| current | 08:49, 22 April 2023 |  | 640 × 480 (33 KB) | PaulSch (talk | contribs) | Updated: 1657.0 – 2023.0 |
| 15:07, 7 April 2022 |  | 640 × 480 (33 KB) | PaulSch (talk | contribs) | Uploaded own work with UploadWizard |
You cannot overwrite this file.
File usage on Commons
The following page uses this file:
File usage on other wikis
The following other wikis use this file:
- Usage on de.wikipedia.org
- Usage on en.wikipedia.org
- Usage on zh.wikipedia.org
Metadata
This file contains additional information such as Exif metadata which may have been added by the digital camera, scanner, or software program used to create or digitize it. If the file has been modified from its original state, some details such as the timestamp may not fully reflect those of the original file. The timestamp is only as accurate as the clock in the camera, and it may be completely wrong.
| Short title | Delta_T |
|---|---|
| Image title | Produced by GNUPLOT 5.2 patchlevel 6 |
| Width | 640 |
| Height | 480 |