File:Cretaceous ocean currents 93 ma 1.svg

Original file (SVG file, nominally 1,409 × 797 pixels, file size: 420 KB)
Captions
Captions
Summary[edit]
| Description |
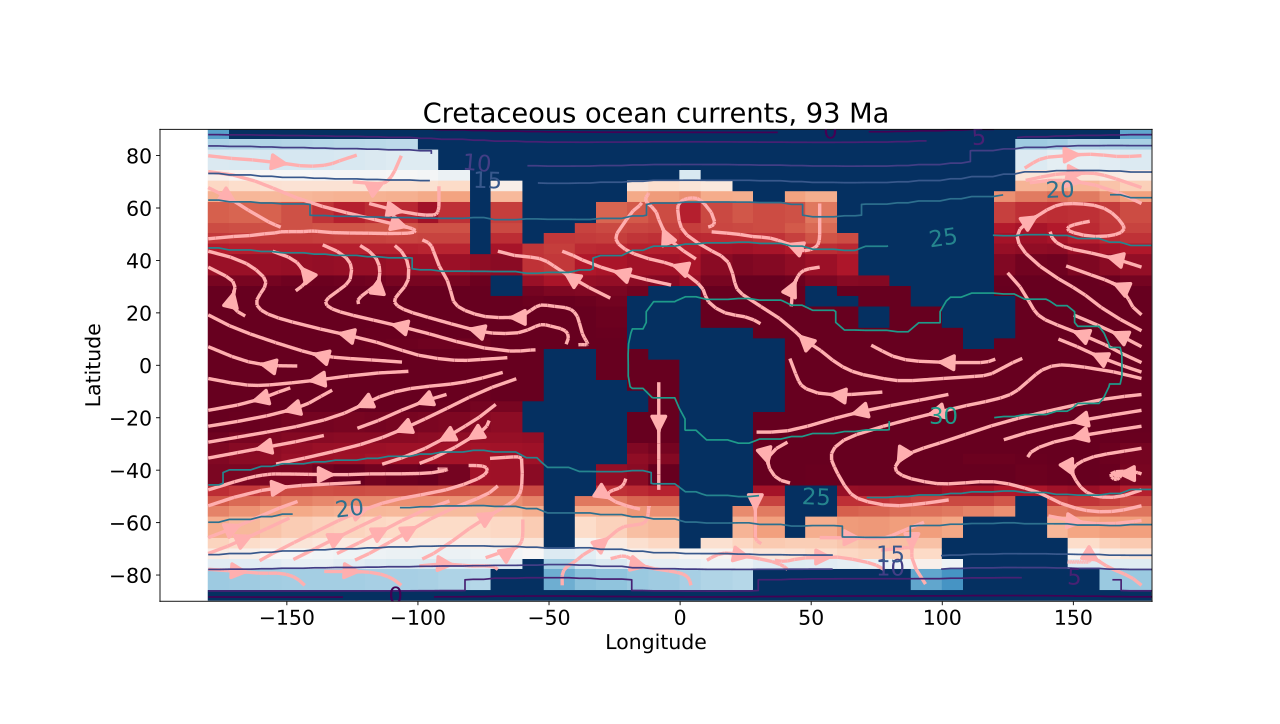
English: Cretacaous sea currents, 93 million years ago. Assumed Co2 4x today, 1120 ppmv. Countous show temperature of air near surface, in Celcius. |
| Date | |
| Source | Own work |
| Author | Merikanto |
| SVG development | This W3C-invalid vector image was created with an unknown SVG tool. |

Data for this image is generated with ccGENIE.muffin EMIC
https://www.seao2.info/mymuffin.html
https://github.com/derpycode/cgenie.muffin
setups lab5 but 93 ma. CO2 4x current, 1120 ppm. Reso of grid 36x36.
R script to obtain data
library(raster)
library(rgdal)
library(ncdf4)
library(rasterVis)
library(RColorBrewer)
save_as_nc<-function(outname1,r, outvar1, longvar1, unit1)
{
	ext2<-c(-180, 180, -90,90)
	extent(r)<-ext2
	crs(r)<-"+proj=longlat +datum=WGS84 +no_defs +ellps=WGS84 +towgs84=0,0,0"
	writeRaster(r, outname1, overwrite=TRUE, format="CDF", varname=outvar1, varunit=unit1,
longname=longvar1, xname="lon", yname="lat")
}
fname1 <-"E:/lautta_cgenie/cretaceous_lab5_93_9yr/fields_biogem_3d.nc"
fname2 <-"E:/lautta_cgenie/cretaceous_lab5_93_9yr/fields_biogem_2d.nc"
mitx=36
mity=36
newx=90
newy=45
datain1 <- nc_open(fname1)
u00 <- ncvar_get(datain1, "phys_u")
v00 <- ncvar_get(datain1, "phys_v")
ocntemp00 <- ncvar_get(datain1, "ocn_temp")
lons <- ncvar_get(datain1, "lon")
lats <- ncvar_get(datain1, "lat")
nc_close(datain1)
datain2 <- nc_open(fname2)
temp00 <- ncvar_get(datain2, "atm_temp")
nc_close(datain2)
idx_level_1=1
idx_time_1=9
u01=u00[,,idx_level_1,idx_time_1]
v01=v00[,,idx_level_1,idx_time_1]
ocntemp01=ocntemp00[,,idx_level_1,idx_time_1]
temp01=temp00[,,idx_time_1]
u02=t(matrix(u01, ncol=mitx))
u11<-flip(raster(u02))
v02=t(matrix(v01, ncol=mitx))
v11<-flip(raster(v02))
ocntemp02=t(matrix(ocntemp01, ncol=mitx))
ocntemp11<-flip(raster(ocntemp02))
temp02=t(matrix(temp01, ncol=mitx))
temp11<-flip(raster(temp02))
ext1<-c(-180, 180, -90,90)
- ext1<-c(-90, 90, -180,180)
crs1<-"+proj=longlat +datum=WGS84 +no_defs +ellps=WGS84 +towgs84=0,0,0"
extent(u11)<-ext1
crs(u11)<-crs1
extent(v11)<-ext1
crs(v11)<-crs1
extent(ocntemp11)<-ext1
crs(ocntemp11)<-crs1
extent(temp11)<-ext1
crs(temp11)<-crs1
msabluna1<-matrix(replicate(newx*newy, 0), nrow = newy, ncol = newx)
- print(msabluna1)
sabluna1<-raster(msabluna1)
extent(sabluna1)<-ext1
crs(sabluna1)<-crs1
- change
u2<-resample(u11, sabluna1,method="ngb" )
v2<-resample(v11, sabluna1,method="ngb" )
ocntemp2<-resample(ocntemp11, sabluna1,method="ngb" )
temp2<-resample(temp11, sabluna1,method="ngb" )
extent(u2)<-ext1
crs(u2)<-crs1
extent(v2)<-ext1
crs(v2)<-crs1
extent(ocntemp2)<-ext1
crs(ocntemp2)<-crs1
extent(temp2)<-ext1
crs(temp2)<-crs1
- str(u2)
- plot(u2)
angel2<-atan2(-v2,u2)
rar2<-sqrt(u2*u2+v2*v2)
- plot(angel2)
- plot(rar2)
- stop(-1)
lonseq2 = seq(-180.0, 180.0, newx/(newx-1))
latseq2 = seq(-90.0, 90.0, newy/(newy-1))
- print (length(lonseq2))
- print (length(latseq2))
save_as_nc("u2.nc",flip(u2), "u", "u", "ms")
save_as_nc("v2.nc",flip(v2), "v", "v", "ms")
save_as_nc("ocntemp2.nc",flip(ocntemp2), "ocntemp", "ocntemp", "C")
save_as_nc("temp2.nc",flip(temp2), "temp", "temp", "C")
stop(-1)
df <- expand.grid(x = lonseq2, y =latseq2)
df$z<-values(rar2)
df$phi<-values(angel2)
r <- rasterFromXYZ(df, crs=crs1)
- crs(r)<-crs1
plot(r)
- vectorplot(r)
- streamplot(r)
streamplot(r, isField=TRUE, streamlet=list(L=30), droplet=list(pc=.3),
par.settings=streamTheme(symbol=brewer.pal(n=5, name='Reds')))
Plt python
import matplotlib.mlab as mlab
import matplotlib.pyplot as plt
from netCDF4 import Dataset
from matplotlib.pylab import *
import numpy as np
from scipy import interpolate
from scipy.interpolate import griddata
finu1 = "u2.nc"
finv1 = "v2.nc"
finocntemp1 = "ocntemp2.nc"
fintemp1 = "temp2.nc"
ncinu1 = Dataset(finu1, "r+", format = "NETCDF4")
ncinv1 = Dataset(finv1, "r+", format = "NETCDF4")
ncinocntemp1 = Dataset(finocntemp1, "r+", format = "NETCDF4", nodata=-3.4e+38)
ncintemp1 = Dataset(fintemp1, "r+", format = "NETCDF4", nodata=-3.4e+38)
lon0 = ncinu1.variables['lon']
lat0 = ncinu1.variables['lat']
u00 = ncinu1.variables['u']
v00 = ncinv1.variables['v']
ocntemp00 = ncinocntemp1.variables['ocntemp']
temp00 = ncintemp1.variables['temp']
- print(type(lon1))
lon1=np.array(lon0)
lat1=np.array(lat0)
- print(lon1)
U=np.array(u00)
V=np.array(v00)
ocntemp=np.array(ocntemp00)
temp=np.array(temp00)
avgtemp=np.mean(temp)
newx=90
newy=45
X = np.arange(-180, 180, 360/newx)
Y = np.arange(-90, 90, 180/newy)
kmap2 = plt.cm.get_cmap('RdBu_r')
kmap1=plt.get_cmap('YlGnBu')
plt.title("Cretaceous ocean currents, 93 Ma", fontsize=24)
plt.xlabel("Longitude", fontsize=18)
plt.xticks(fontsize=18)
plt.ylabel("Latitude", fontsize=18)
plt.yticks(fontsize=18)
- plt.imshow(flip(fliplr(U)), extent=(-180,180,-90,90), cmap=kmap1 )
plt.imshow(flip(fliplr(temp)), extent=(-180,180,-90,90), cmap=kmap2, vmin=-0, vmax=30 )
plt.imshow(flip(fliplr(ocntemp)), extent=(-180,180,-90,90), cmap=kmap2, vmin=-0, vmax=30 )
s = plt.streamplot(X, Y, U, V, linewidth=3, color='#FFAFAF',  arrowsize=3)
contourrange1=[0, 5, 10,15,20,25,30,35,40,45,50,55]
cs = plt.contour(temp, extent=(-180,180,-90,90), inline=True, levels=contourrange1)
plt.clabel(cs, fontsize=20, inline=1,fmt = '%3.0f')
- plt.imshow(flip(fliplr(temp)), extent=(-180,180,-90,90), cmap=kmap2, vmin=-0, vmax=30 )
plt.show()
Licensing[edit]
- You are free:
- to share – to copy, distribute and transmit the work
- to remix – to adapt the work
- Under the following conditions:
- attribution – You must give appropriate credit, provide a link to the license, and indicate if changes were made. You may do so in any reasonable manner, but not in any way that suggests the licensor endorses you or your use.
- share alike – If you remix, transform, or build upon the material, you must distribute your contributions under the same or compatible license as the original.
File history
Click on a date/time to view the file as it appeared at that time.
| Date/Time | Thumbnail | Dimensions | User | Comment | |
|---|---|---|---|---|---|
| current | 13:31, 1 January 2022 | | 1,409 × 797 (420 KB) | Merikanto (talk | contribs) | Uploaded own work with UploadWizard |
You cannot overwrite this file.
File usage on Commons
There are no pages that use this file.