File:Cournot competition.svg
Jump to navigation
Jump to search

Size of this PNG preview of this SVG file: 500 × 500 pixels. Other resolutions: 240 × 240 pixels | 480 × 480 pixels | 768 × 768 pixels | 1,024 × 1,024 pixels | 2,048 × 2,048 pixels.
Original file (SVG file, nominally 500 × 500 pixels, file size: 3 KB)
Captions
Captions
Add a one-line explanation of what this file represents
Summary
[edit]
| Description |
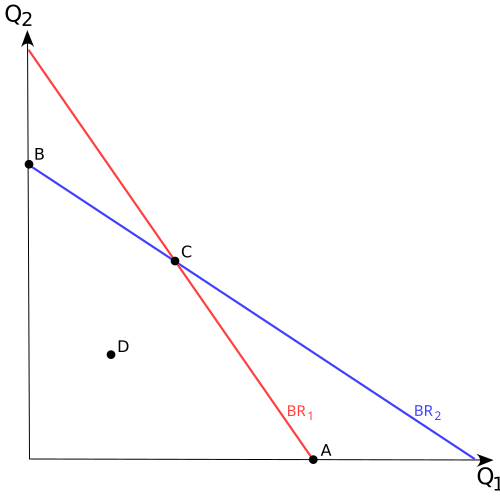
English: An illustration of best response curves in the context of Cournot competition (the Cournot equilibrium is labelled C). A and B represent monopoly positions, whilst D is a possible cooperative point that yields greater joint profits than C. |
| Date | (UTC) |
| Source | |
| Author |
|
Licensing
[edit]
This file is licensed under the Creative Commons Attribution-Share Alike 3.0 Unported license.
- You are free:
- to share – to copy, distribute and transmit the work
- to remix – to adapt the work
- Under the following conditions:
- attribution – You must give appropriate credit, provide a link to the license, and indicate if changes were made. You may do so in any reasonable manner, but not in any way that suggests the licensor endorses you or your use.
- share alike – If you remix, transform, or build upon the material, you must distribute your contributions under the same or compatible license as the original.
Original upload log
[edit]
This image is a derivative work of the following images:
- File:Supply-and-demand.svg licensed with Cc-by-sa-2.5,2.0,1.0, Cc-by-sa-3.0-migrated, GFDL
- 2006-04-29T17:48:53Z Faxe 500x500 (13094 Bytes) [[Image:Supply-and-demand.svg|thumb]] == Opis == {{en|Supply and Demand}} * P - price * Q - quantity of good * S - supply * D - demand * author: Paweł Zdziarski (faxe) * created with [[:en:Inkscape]] {{pl|Popyt i podaż}
- 2006-04-29T17:38:06Z Faxe 500x500 (13096 Bytes) == Opis == {{en|Supply and Demand}} * author: Paweł Zdziarski (faxe) * created with [[:en:Inkscape]] {{pl|Popyt i podaż}} * autor: Paweł Zdziarski (faxe) * stworzone w [[:pl:Inkscape]] [[Category:Economics diagrams]]
- 2006-04-29T17:20:56Z Faxe 500x500 (9478 Bytes) {{en|Supply and Demand}} * author: Paweł Zdziarski (faxe) * created with [[:en:Inkscape]] {{pl|Popyt i podaż}} * autor: Paweł Zdziarski (faxe) * stworzone w [[:pl:Inkscape]] [[Category:Economics diagrams]]
- File:Production_Possibilities_Frontier_Curve.svg licensed with Cc-by-sa-2.5,2.0,1.0, Cc-by-sa-3.0-migrated, GFDL
- 2010-01-06T12:19:35Z Jarry1250 470x475 (13608 Bytes) Crop title off so can be used in more places
- 2006-12-18T12:01:47Z Everlong 470x500 (13742 Bytes) {{Information |Description=A diagram showing the production possibilities frontier (PPF) curve for producing "guns" and "butter". Point "A" lies below the curve, denoting underutilized production capacity. Points "B", "C", an
Uploaded with derivativeFX
File history
Click on a date/time to view the file as it appeared at that time.
| Date/Time | Thumbnail | Dimensions | User | Comment | |
|---|---|---|---|---|---|
| current | 12:07, 7 December 2011 | | 500 × 500 (3 KB) | Jarry1250 (talk | contribs) | == {{int:filedesc}} == {{Information |Description={{en|An illustration of en:best response curves in the context of en:Cournot competition (the Cournot equilibrium is labelled C). A and B represent monopoly positions, whilst D is a possible co |
You cannot overwrite this file.
File usage on Commons
There are no pages that use this file.
File usage on other wikis
The following other wikis use this file:
- Usage on cs.wikipedia.org
- Usage on en.wikipedia.org