File:Counterrad Oct2005 100dpi de.png
Jump to navigation
Jump to search
Size of this preview: 800 × 575 pixels. Other resolutions: 320 × 230 pixels | 640 × 460 pixels | 880 × 633 pixels.
Original file (880 × 633 pixels, file size: 26 KB, MIME type: image/png)
Captions
Captions
Add a one-line explanation of what this file represents
Summary
[edit]
| Description |
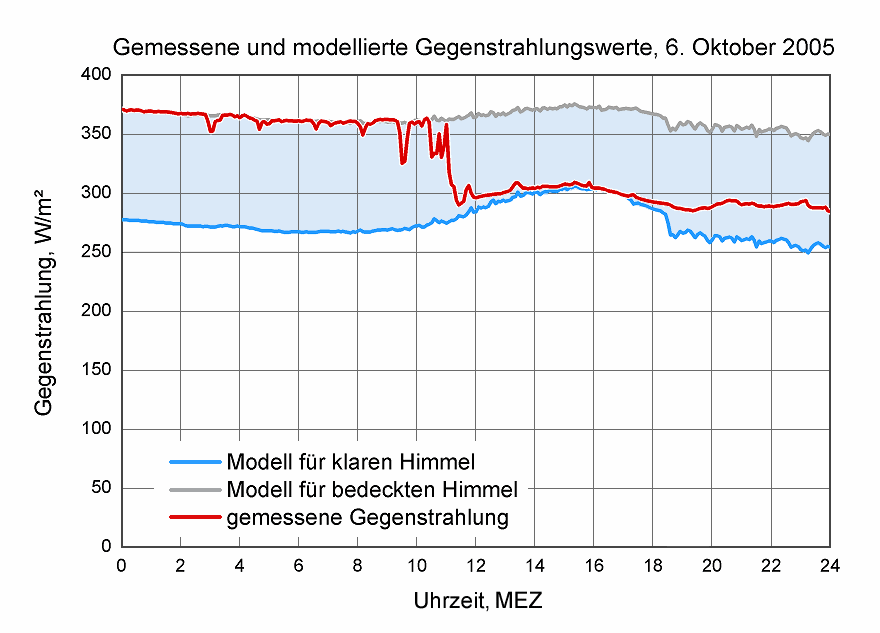
Description: Deutsch: Die rote Kurve zeigt den Verlauf der langwelligen atmosphärischen Gegenstrahlung am 6. Oktober 2005. Während des Vormittags herrschte Hochnebel. Die Nebeltröpfchen trugen als effiziente langwellige Strahler zu relativ hohen Strahlungswerten bei. Gegen Mittag löste sich der Nebel auf und ließ einen klaren Himmel zurück. Die Atmosphärengase sind weniger effiziente langwellige Strahler, die Strahlungswerte gingen daher merklich zurück. Die graue und die blaue Kurve wurden für bedeckten bzw. klaren Himmel mittels empirischer Strahlungsmodelle aus den gleichzeitig gemessenen Temperaturen und Luftfeuchten berechnet.
English: The red curve shows the atmospheric long-wave counterradiation on October 6, 2005. In the morning, the sky was covered by high fog. The water droplets, being efficient long-wave emitters, contributed to high radiation values. Around noon the fog dispersed and left a cloudless sky. The atmosphere gases are less efficient long-wave emitters, the radiation values therefore dropped markedly. The gray and blue curves have been derived from the simultaneously measured temperatures and humidities, using empirical radiation models for cloudy and clear skies, respectively.
|
| Date | 7 March 2007 (original upload date) |
| Source | No machine-readable source provided. Own work assumed (based on copyright claims). |
| Author | No machine-readable author provided. Sch assumed (based on copyright claims). |
Licensing
[edit]
I, the copyright holder of this work, hereby publish it under the following licenses:

|
Permission is granted to copy, distribute and/or modify this document under the terms of the GNU Free Documentation License, Version 1.2 or any later version published by the Free Software Foundation; with no Invariant Sections, no Front-Cover Texts, and no Back-Cover Texts. A copy of the license is included in the section entitled GNU Free Documentation License. |
| This file is licensed under the Creative Commons Attribution-Share Alike 3.0 Unported license. | ||
| ||
| This licensing tag was added to this file as part of the GFDL licensing update. |
You may select the license of your choice.
File history
Click on a date/time to view the file as it appeared at that time.
| Date/Time | Thumbnail | Dimensions | User | Comment | |
|---|---|---|---|---|---|
| current | 20:48, 7 March 2007 | | 880 × 633 (26 KB) | Sch (talk | contribs) | *Description: {{german}} Die rote Kurve zeigt den Verlauf der langwelligen atmosphärischen Gegenstrahlung am 6. Oktober 2005. Während des Vormittags herrschte Hochnebel. Die Nebeltröpfchen trugen als effiziente langwellige Strahler zu relativ hohen Str |
You cannot overwrite this file.
File usage on Commons
There are no pages that use this file.
File usage on other wikis
The following other wikis use this file:
- Usage on de.wikipedia.org
- Usage on no.wikipedia.org