File:Correspondence analysis plot for all subpopulations in the Japan-MICC.png
Jump to navigation
Jump to search
Size of this preview: 610 × 600 pixels. Other resolutions: 244 × 240 pixels | 488 × 480 pixels | 996 × 979 pixels.
Original file (996 × 979 pixels, file size: 275 KB, MIME type: image/png)
Captions
Captions
Add a one-line explanation of what this file represents
| Description |
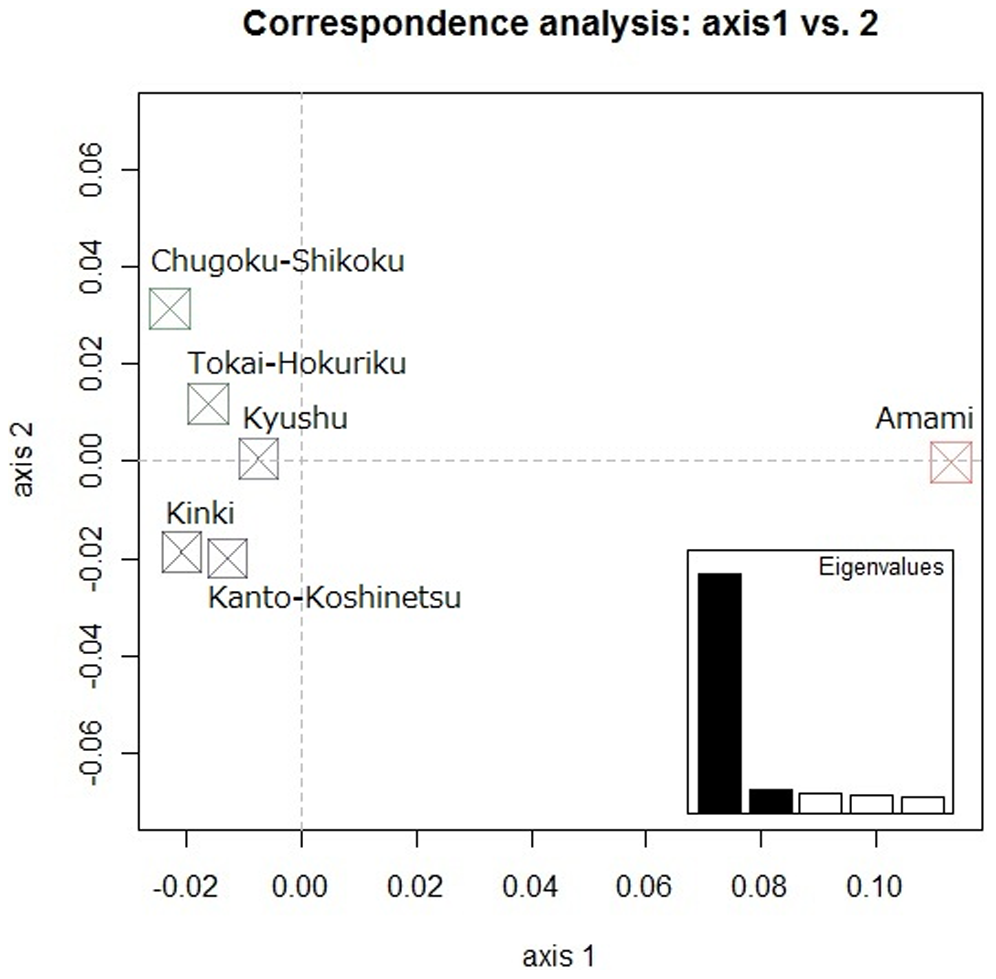
English: Correspondence analysis plot of the first and second principal components for all subpopulations in the J-MICC (Japan Multi-Institutional Collaborative Cohort).
Correspondence analysis was conducted using 222 loci for six subpopulations (Kanto-Koshinetsu, Tokai-Hokuriku, Kinki, Chugoku-Shikoku, Kyushu and the Amami Islands) in the J-MCC. The scree plot is shown in the lower right corner of this figure. Although PCA did not clearly separate the Amami Islanders from the other subpopulations of the mainland, CA did clearly separate the Amami Islanders from the other subpopulations. As shown in the scree plot in the lower right portion of the figure, the first principal component accounts for a vast majority (≈75%) of the variability; the separation between the Amami Islanders and the rest of the subpopulations was described by this key principal axis. |
| Date | Published: April 3, 2012 |
| Source | Nishiyama T, Kishino H, Suzuki S, Ando R, Niimura H, Uemura H, et al. (2012) Detailed Analysis of Japanese Population Substructure with a Focus on the Southwest Islands of Japan. PLoS ONE 7(4): e35000. doi:10.1371/journal.pone.0035000 http://journals.plos.org/plosone/article?id=10.1371/journal.pone.0035000 |
| Author | Takeshi Nishiyama, Hirohisa Kishino, Sadao Suzuki, Ryosuke Ando, Hideshi Niimura, Hirokazu Uemura, Mikako Horita, Keizo Ohnaka, Nagato Kuriyama, Haruo Mikami, Naoyuki Takashima, Keitaro Mastuo, Yin Guang, Kenji Wakai, Nobuyuki Hamajima, Hideo Tanaka, for the J-MICC Study Group |
| Permission (Reusing this file) |
This is an open-access article distributed under the terms of the Creative Commons Attribution License |
| Other versions |
|


|
This file is licensed under the Creative Commons Attribution 2.5 Generic license.
|
This file was published in a Public Library of Science journal. Their website states that the content of all PLOS journals is published under the Creative Commons Attribution 4.0 license (or its previous version depending on the publication date), unless indicated otherwise.
|
File history
Click on a date/time to view the file as it appeared at that time.
| Date/Time | Thumbnail | Dimensions | User | Comment | |
|---|---|---|---|---|---|
| current | 18:01, 1 February 2017 | | 996 × 979 (275 KB) | Was a bee (talk | contribs) | {{Information |Description={{en|1=Correspondence analysis plot of the first and second principal components for all subpopulations in the J-MICC (Japan Multi-Institutional Collaborative Cohort). Correspondence analysis was conducted using 222 loci for... |
You cannot overwrite this file.
File usage on Commons
The following 7 pages use this file:
- File:Correspondence analysis plot for all subpopulations in the Japan-MICC.png
- File:Correspondence analysis plot for the mainland population, Amami Islanders and Okinawa Islanders.png
- File:Empirical distribution of FST values per locusbetween the Amami Islanders and the Japan mainland population.png
- File:Geographic locations of the populations studied in Japan.png
- File:Heterozygosity per locus for the Amami Islanders and the mainland population.png
- File:PCA plot for the Japan mainland population and the Amami Islanders.png
- File:PCA plot for the Japan mainland population and the Okinawa Islanders using different number of loci.png