File:Correlation of gas production and seismicity Groningen Vlek 2019 EnvEarthSci 78(3) 59 fig 3.png
Jump to navigation
Jump to search

Size of this preview: 487 × 600 pixels. Other resolutions: 195 × 240 pixels | 390 × 480 pixels | 624 × 768 pixels | 1,030 × 1,268 pixels.
Original file (1,030 × 1,268 pixels, file size: 314 KB, MIME type: image/png)
Captions
Captions
Add a one-line explanation of what this file represents
Summary[edit]
_59_fig_3.png&action=edit§ion=1)
| Description |
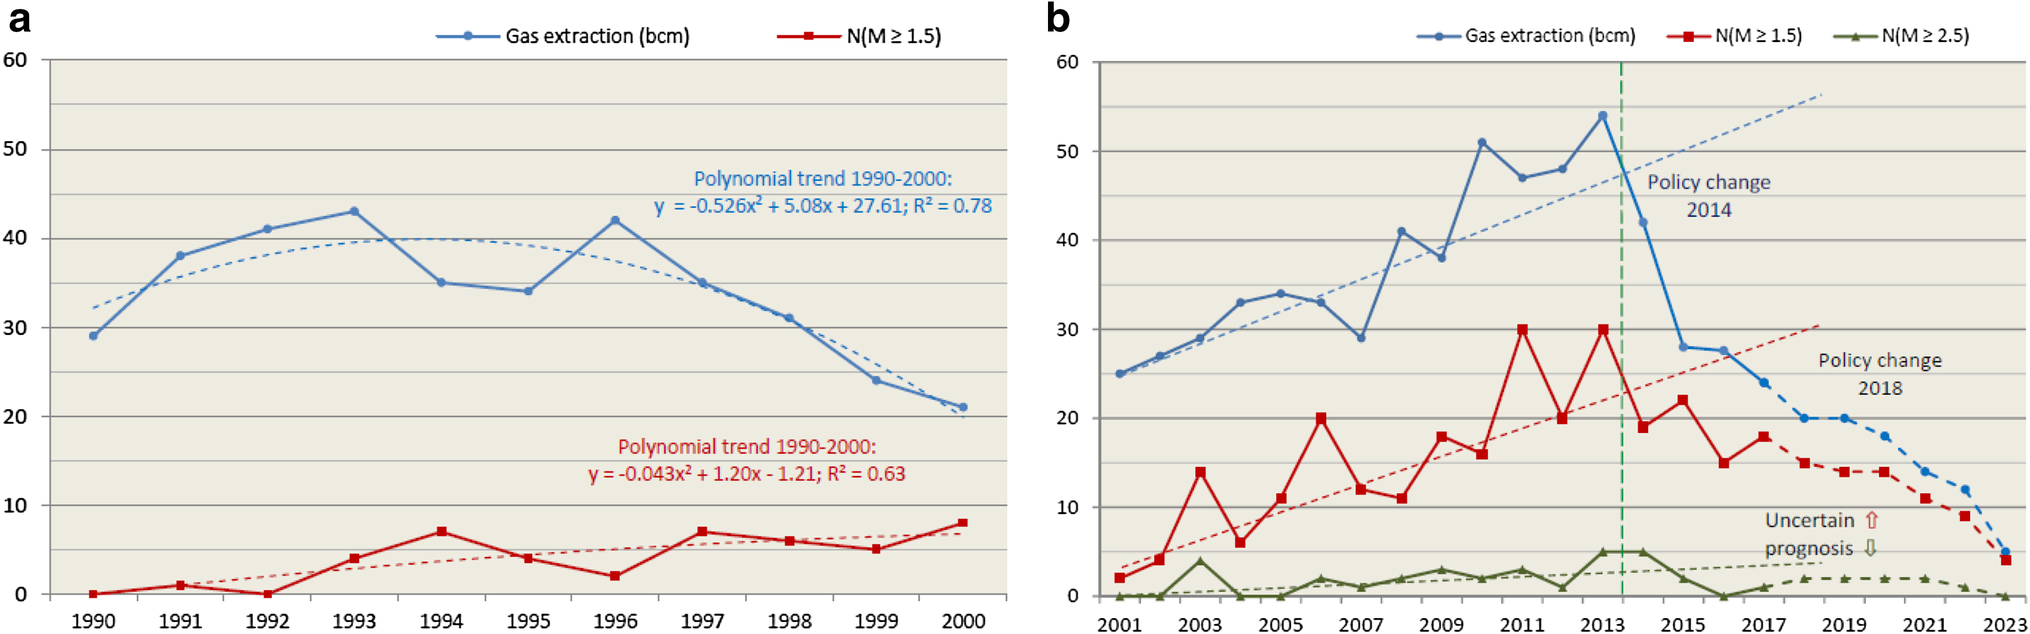
English: Original figure caption: a, b Annual gas extraction (bcm; upper curve) versus annual number (N) of earthquakes with M ≥ 1.5 and ≥ 2.5 (Richter; lower curves). The ordinate (y) fits both annual bcm and earthquake frequency. Basic data from NAM (2016a, 2018) and KNMI (2018). Statistical trends (dashed) over time have been separately fitted for periods 1990–2000 (a) and 2001–2013 (b), excluding 2014–2018.
Deutsch: Induzierte Seismizität im Gasfeld Groningen: Jährliche Erdgasförderung (in bcm = milliarden Kubikmeter; blaue obere Kurven) im Vergleich zur jährlichen Anzahl der Erdbeben (N) mit Magnituden ≥1,5 und ≥2,5 (Richterskala; rote bzw. grüne untere Kurve(n)). Die Zahlen an der Ordinate (y-Achse) gelten jeweils für alle Kurven. Die Rohdaten stammen von NAM (2016a, 2018) und KNMI (2018). Die Steigung der Trendlinien (gestrichelt) ist für die Zeiträume 1990–2000 (a) und 2001–2013 (b) jeweils separat berechnet worden, abzüglich des Zeitraumes von 2014–2018. |
| Date | (original online publication date) |
| Source | Fig. 3 in: Rise and reduction of induced earthquakes in the Groningen gas field, 1991–2018: statistical trends, social impacts, and policy change. Environmental Earth Sciences 78(3):59, doi:10.1007/s12665-019-8051-4 |
| Author |
|
| Permission (Reusing this file) |
The original version of this image was published in Environmental Earth Sciences journal. On the webpage that contains the HTML version of the respective article (link.springer.com, see DOI link above) it is stated that it “is distributed under the terms of the Creative Commons Attribution 4.0 International License (https://creativecommons.org/licenses/by/4.0/)”. |
Licensing[edit]
_59_fig_3.png&action=edit§ion=2)
This file is licensed under the Creative Commons Attribution 4.0 International license.
- You are free:
- to share – to copy, distribute and transmit the work
- to remix – to adapt the work
- Under the following conditions:
- attribution – You must give appropriate credit, provide a link to the license, and indicate if changes were made. You may do so in any reasonable manner, but not in any way that suggests the licensor endorses you or your use.
File history
Click on a date/time to view the file as it appeared at that time.
| Date/Time | Thumbnail | Dimensions | User | Comment | |
|---|---|---|---|---|---|
| current | 15:57, 24 May 2019 | | 1,030 × 1,268 (314 KB) | Gretarsson (talk | contribs) | {{Information |description ={{en|1=Original figure caption: ''a, b Annual gas extraction (bcm; upper curve) versus annual number (N) of earthquakes with M ≥ 1.5 and ≥ 2.5 (Richter; lower curves). The ordinate (y) fits both annual bcm and earthquake frequency. Basic data from NAM (2016a, 2018) and KNMI (2018). Statistical trends (dashed) over time have been separately fitted for periods 1990–2000 (a) and 2001–2013 (b), excluding 2014–2018.''}} {{de|1=Induzierte Seismizität im Gasfeld Groning... |
You cannot overwrite this file.
File usage on Commons
The following page uses this file:
File usage on other wikis
The following other wikis use this file:
- Usage on az.wikipedia.org
- Usage on de.wikipedia.org
- Usage on www.wikidata.org
_59_fig_3.png&oldid=868671102)