File:Classical Multidimensional Scaling (MDS) analysis performed on the 1,719 samples.png
From Wikimedia Commons, the free media repository
Jump to navigation
Jump to search

Size of this preview: 640 × 600 pixels. Other resolutions: 256 × 240 pixels | 820 × 768 pixels | 1,093 × 1,024 pixels | 1,345 × 1,260 pixels.
Original file (1,345 × 1,260 pixels, file size: 420 KB, MIME type: image/png)
File information
Structured data
Captions
Captions
Add a one-line explanation of what this file represents
| DescriptionClassical Multidimensional Scaling (MDS) analysis performed on the 1,719 samples.png |
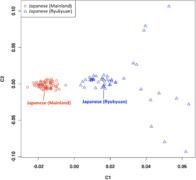
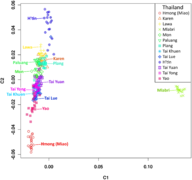
English: Classical Multidimensional Scaling (MDS) analysis performed on the 1,719 samples. The pattern is consistent with the structure inferred in a previous study. The 18 individuals from Mlabri (TH-MA, Mlabri from Nan province, Thailand) clustered together within their population but did not overlap with the others. Twenty-six Uyghur individuals (CN-UG, Uyghur from Hetian, Xinjiang, China) did not cluster with individuals from other populations from China but formed a distinct one slightly overlapping with the cluster of Indian individuals, which could reflect that the Uyghur is an admixed population with Western Eurasian ancestry. Similarly, five Melanesians individuals (AX-ME, Melanesians from Indo-Pacific) formed a distinct cluster and slightly overlapped with Indonesian populations. Individuals from India tend to disperse from each other, indicating a more significant genetic divergence among populations and individuals in India. In addition, the individuals from Japan (JP) and South Korea (KR) clustered tightly together and slightly overlapped with individuals from China, reflecting a close genetic relationship between Japanese and Korean populations, which was also observed in the previous study. |
| Date | Published: December 29, 2011 |
| Source | Yang X, Xu S, The HUGO Pan-Asian SNP Consortium (2011) Identification of Close Relatives in the HUGO Pan-Asian SNP Database. PLoS ONE 6(12): e29502. doi:10.1371/journal.pone.0029502 http://journals.plos.org/plosone/article?id=10.1371/journal.pone.0029502 |
| Author | Xiong Yang, Shuhua Xu , The HUGO Pan-Asian SNP Consortium |
| Permission (Reusing this file) |
This is an open-access article distributed under the terms of the Creative Commons Attribution License |
| Other versions |
|
|
This file is licensed under the Creative Commons Attribution 2.5 Generic license.
|
This file was published in a Public Library of Science journal. Their website states that the content of all PLOS journals is published under the Creative Commons Attribution 4.0 license (or its previous version depending on the publication date), unless indicated otherwise.
|
File history
Click on a date/time to view the file as it appeared at that time.
| Date/Time | Thumbnail | Dimensions | User | Comment | |
|---|---|---|---|---|---|
| current | 06:12, 4 February 2017 |  | 1,345 × 1,260 (420 KB) | Was a bee (talk | contribs) | {{Information |Description={{en|1=Classical Multidimensional Scaling (MDS) analysis performed on the 1,719 samples. The pattern is consistent with the structure inferred in a previous study. The 18 individuals from Mlabri ('''TH-MA''', Mlabri from Nan... |
You cannot overwrite this file.
File usage on Commons
The following 12 pages use this file:
- File:Classical Multidimensional Scaling (MDS) analysis performed on the 1,719 samples.png
- File:MDS analysis of samples from China.png
- File:MDS analysis of samples from India.png
- File:MDS analysis of samples from Indonesia.png
- File:MDS analysis of samples from Japan.png
- File:MDS analysis of samples from Malaysia.png
- File:MDS analysis of samples from Singapore.png
- File:MDS analysis of samples from South Korea.png
- File:MDS analysis of samples from Taiwan.png
- File:MDS analysis of samples from Thailand.png
- File:MDS analysis of samples from the Philippines.png
- Template:Journal.pone.0029502
Metadata
This file contains additional information such as Exif metadata which may have been added by the digital camera, scanner, or software program used to create or digitize it. If the file has been modified from its original state, some details such as the timestamp may not fully reflect those of the original file. The timestamp is only as accurate as the clock in the camera, and it may be completely wrong.
| Horizontal resolution | 118.11 dpc |
|---|---|
| Vertical resolution | 118.11 dpc |
Structured data
Items portrayed in this file
depicts
image/png
b1e69ea7d09adeba290d030fc177e65445d13772
430,281 byte
1,260 pixel
1,345 pixel
Categories:
- MDS plots of human genetic diversity
- Human genetic diversity
- Genetic studies on Asian populations
- Genetic studies on Mlabri
- Genetic studies on Uyghur
- Genetic studies on Melanesian
- Genetic studies on Japanese
- Genetic studies on Korean
- Genetic studies on Singaporeans
- Genetic studies on Thailand
- Genetic studies on Filipinos
- Genetic studies on Indian
- Genetic studies on Indonesians
- Genetic studies on Chinese
- Genetic studies on Malaysians
- Genetic studies on Taiwanese
Hidden category:


