File:Chart of UK Positive COVID-19 Antibody Tests from 2021-01-01 to 2021-07-01.svg
Jump to navigation
Jump to search

Size of this PNG preview of this SVG file: 576 × 432 pixels. Other resolutions: 320 × 240 pixels | 640 × 480 pixels | 1,024 × 768 pixels | 1,280 × 960 pixels | 2,560 × 1,920 pixels.
Original file (SVG file, nominally 576 × 432 pixels, file size: 81 KB)
Captions
Captions
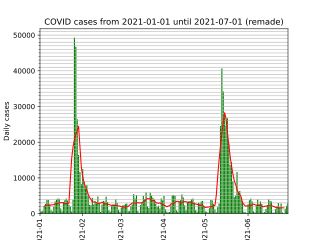
Chart of UK Positive COVID-19 Antibody Tests from 2021-01-01 to 2021-07-01
Summary[edit]
| Description |
English: This chart is a remake of https://commons.wikimedia.org/wiki/File:Chart_of_UK_COVID-19_daily_new_cases.png with up-to-date data and source code.
It was generated with the following source code using UK government data (link included): from matplotlib import pyplot as plt
from urllib.request import urlopen
import pandas
import datetime
import pandas as pd
import io
import numpy as np
import matplotlib.ticker as ticker
URL = "https://api.coronavirus.data.gov.uk/v2/data?areaType=overview&metric=newAntibodyTestsByPublishDate&format=csv"
data = urlopen(URL).read()
df = pd.read_csv(io.BytesIO(data))
df = df.assign(date=pd.to_datetime(df["date"]))
def add_moving_average(df):
df["moving_average"] = moving_average(df["newAntibodyTestsByPublishDate"])
def moving_average(data):
window_size = 7
return np.concatenate([[float('nan')] * 3, np.convolve(data, np.ones(window_size)/window_size, mode='valid'), [float('nan')] * 3])
def plot_cases(df, start, end):
df_2021_h1 = df[df.date >= start][df.date < end].sort_values("date")
add_moving_average(df_2021_h1)
plt.bar(df_2021_h1["date"], df_2021_h1["newAntibodyTestsByPublishDate"], color="green", label="Daily")
plt.plot(df_2021_h1["date"], df_2021_h1["moving_average"], color="red", label="7-day roling average")
plt.gca().yaxis.set_minor_locator(ticker.MultipleLocator(1000))
plt.ylabel("Daily cases")
plt.xlim((list(df_2021_h1["date"])[0], list(df_2021_h1["date"])[-1]))
plt.grid(axis="y", which="both")
plt.title(f"COVID cases from {start.date().isoformat()} until {end.date().isoformat()} (remade)")
plt.xticks(rotation=90)
plt.savefig(f"Chart of UK Positive COVID-19 Antibody Tests from {start.date().isoformat()} to {end.date().isoformat()} (remade).svg")
plot_cases(df, datetime.datetime(2021, 1, 1), datetime.datetime(2021, 7, 1))
plt.clf()
plot_cases(df, datetime.datetime(2021, 7, 1), datetime.datetime(2022, 1, 1))
plt.clf()
plot_cases(df, datetime.datetime(2022, 1, 1), datetime.datetime(2022, 7, 1))
plt.clf()
plot_cases(df, datetime.datetime(2022, 7, 1), datetime.datetime(2023, 1, 1))
|
| Date | |
| Source | Own work |
| Author | Talpedia |
Licensing[edit]
I, the copyright holder of this work, hereby publish it under the following license:
This file is licensed under the Creative Commons Attribution-Share Alike 4.0 International license.
- You are free:
- to share – to copy, distribute and transmit the work
- to remix – to adapt the work
- Under the following conditions:
- attribution – You must give appropriate credit, provide a link to the license, and indicate if changes were made. You may do so in any reasonable manner, but not in any way that suggests the licensor endorses you or your use.
- share alike – If you remix, transform, or build upon the material, you must distribute your contributions under the same or compatible license as the original.
File history
Click on a date/time to view the file as it appeared at that time.
| Date/Time | Thumbnail | Dimensions | User | Comment | |
|---|---|---|---|---|---|
| current | 15:11, 18 December 2022 | | 576 × 432 (81 KB) | Talpedia (talk | contribs) | Remove rename from title |
| 20:31, 17 December 2022 |  | 576 × 432 (81 KB) | Talpedia (talk | contribs) | Uploaded own work with UploadWizard |
You cannot overwrite this file.
File usage on Commons
There are no pages that use this file.
File usage on other wikis
The following other wikis use this file:
- Usage on en.wikipedia.org