File:Chapman function.svg
Jump to navigation
Jump to search

Size of this PNG preview of this SVG file: 270 × 270 pixels. Other resolutions: 240 × 240 pixels | 480 × 480 pixels | 768 × 768 pixels | 1,024 × 1,024 pixels | 2,048 × 2,048 pixels.
Original file (SVG file, nominally 270 × 270 pixels, file size: 28 KB)
Captions
Captions
Add a one-line explanation of what this file represents
Summary[edit]
| Description |
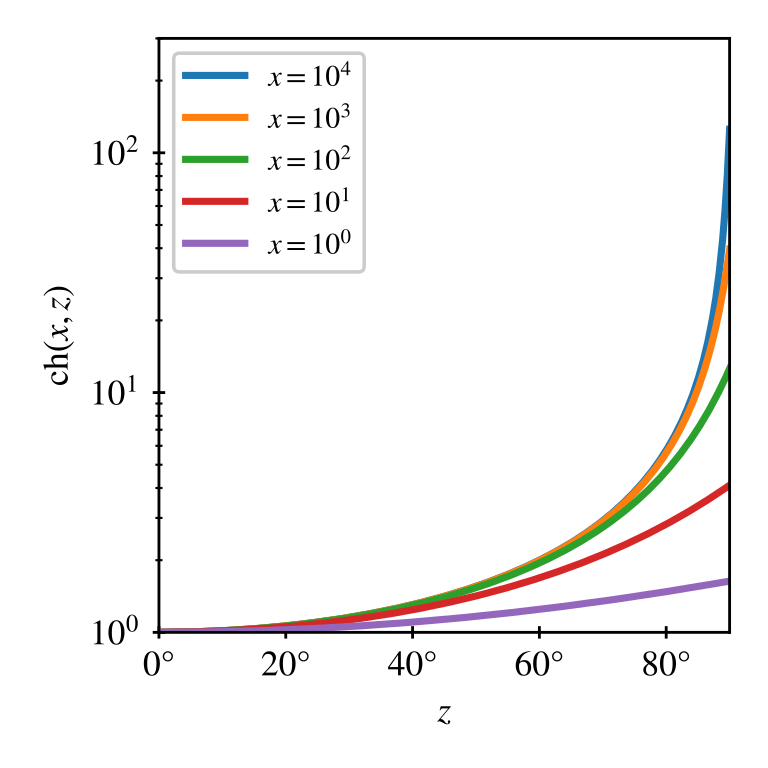
English: Graphs of the Chapman function |
||
| Source | Own work | ||
| Author | Maximilian Reininghaus | ||
| Permission (Reusing this file) |
|
Source code[edit]
import numpy as np
import scipy.integrate
import matplotlib.pyplot as plt

@np.vectorize
def chapman(x, theta):
    f = lambda l, x, theta: np.exp(-(np.sqrt(x**2 + l**2 + 2*l*x*np.cos(theta)) - x))
    result, err = scipy.integrate.quad(f, 0, np.inf, args=(x, theta))
    return result

th = np.linspace(0, 90, 200)

fig, ax = plt.subplots(dpi=200, figsize=(3,3))
ax.set(yscale="log", ylim=(1, 3e2), xlim=(0, 90), xlabel="$z$", ylabel=r"$\mathrm{ch}(x,z)$")
ax.xaxis.set_major_formatter('{x:.0f}°')

for x in np.logspace(4, 0, 5):
    ch = chapman(x, np.deg2rad(th))
    ax.plot(th, ch, label=f"$x = 10^{{{np.log10(x):.0f}}}$", lw=2)

ax.legend(loc="upper left", fontsize="small")

fig.tight_layout()
fig.savefig("chapman_function.svg")
File history
Click on a date/time to view the file as it appeared at that time.
| Date/Time | Thumbnail | Dimensions | User | Comment | |
|---|---|---|---|---|---|
| current | 12:12, 4 April 2022 | | 270 × 270 (28 KB) | Maximilian Reininghaus (talk | contribs) | {{Information |Description = {{en|1=Graphs of the Chapman function}} |source ={{own}} |author =Maximilian Reininghaus |permission ={{FAL-1.3}} }} Category:Special functions |
You cannot overwrite this file.
File usage on Commons
There are no pages that use this file.
File usage on other wikis
The following other wikis use this file:
- Usage on en.wikipedia.org