File:Change in total heat content of earth.svg
Jump to navigation
Jump to search

Size of this PNG preview of this SVG file: 640 × 480 pixels. Other resolutions: 320 × 240 pixels | 1,024 × 768 pixels | 1,280 × 960 pixels | 2,560 × 1,920 pixels.
Original file (SVG file, nominally 640 × 480 pixels, file size: 28 KB)
Captions
Captions
Add a one-line explanation of what this file represents
Summary[edit]
| Description |
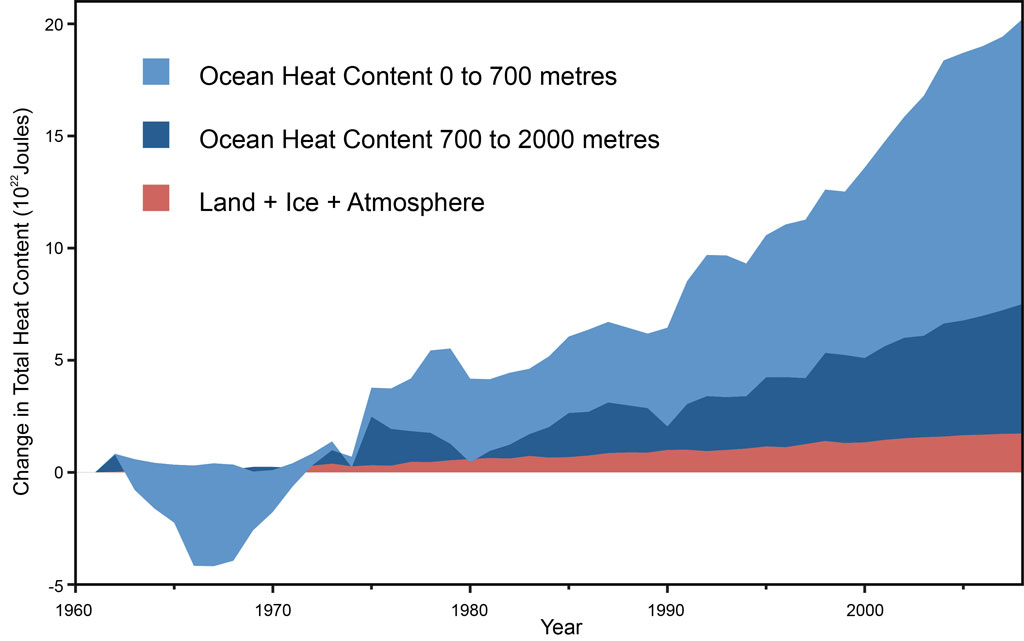
Deutsch: Änderung des Wärmeinhalts der Erde. Braun: Eis + Land + Atmosphäre, Dunkelblau: Ozeanwasser in 700 bis 2000m Tiefe. Hellblau: Ozeanwasser in 700 bis 0m Tiefe. Daten aus [1].
Angezeigt sind jeweils die bereits aufsummierten Daten: Erwärmung der Wassersäule 0–700 m
Erwärmung der Wassersäule 700–2000 m
Erwärmung der Eis- und Landflächen sowie der Atmosphäre English: Change in the heat content of the Earth. Brown: ice, land, and atmosphere. Dark blue: ocean water from 700 to 2000 m depth. Light blue: ocean water from 700 to 0 m depth. From [2] (Excel xlsx-sheet).
Data legend: Heat of the water column 0–700 m
Heat of the water column 700–2000 m
Heat of the ice, land, and atmosphere |
|||
| Date | ||||
| Source | Own work? and see here! | |||
| Author | StefanPohl? and see here! | |||
| Permission (Reusing this file) |
I, the copyright holder of this work, hereby publish it under the following license:
|
|||
| Other versions | Publikationsdatum 8. März 2014 19:34:53 |
English: This graph shows how much more global warming is heating the oceans vs the combined heating of land, ice, and atmosphere.
Français : Ce graphique montre que dans le cadre du réchauffement climatique, concernant la quantité totale de chaleur accumulée dans le système climatique de la Terre sur un peu plus de 40 ans (de 1962 à 2008) il y a beaucoup plus et de plus en plus de chaleur qui a été stockée dans les océans que dans les milieux terrestres ; Ce graphique a été fait dans le cadre d'une mise à jour rapportée par Church et al dans un article intitulé ""Revisiting the Earth's sea-level and energy budgets from 1961 to 2008" (DOI:10.1029/2011GL048794)
This plot was created with Gnuplot.
File history
Click on a date/time to view the file as it appeared at that time.
| Date/Time | Thumbnail | Dimensions | User | Comment | |
|---|---|---|---|---|---|
| current | 06:43, 20 September 2014 | | 640 × 480 (28 KB) | StefanInaktiv (talk | contribs) | User created page with UploadWizard |
You cannot overwrite this file.
File usage on Commons
The following 5 pages use this file:
File usage on other wikis
The following other wikis use this file:
- Usage on de.wikipedia.org
- Usage on fr.wikipedia.org
- Usage on www.wikidata.org