File:Ccsm3 trace21k tjuly 21000bp europe 2.svg

Original file (SVG file, nominally 1,236 × 1,052 pixels, file size: 12.54 MB)
Captions
Captions
Summary
[edit]| Description |
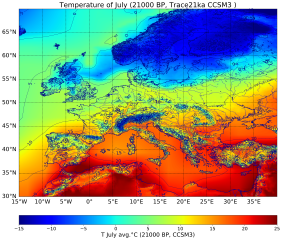
English: Average temperature of July, 21000 years ago, Europe. |
| Date | |
| Source | Own work |
| Author | Merikanto |

This image is downscaled Trace21ka CCSM3 TS data slice.
Downslscaling elevation data is GLACC1d and ETOPO1.
Downscaling is done with various R scripts that usess R dissever 'lm' downscaling against GLAC1D and simple lapse rate delta method against ETOPO1 raster.
Note: The downslaling is maybeaccurate due to inaccuracies in scripts.
Scipts are there
File:CCSM3_17000BP_JulyT_1.svg
Data is visualized with Anaconda "conda" Python script. Uses matplotlib, baemap ...
pplotdata.py
- netcdf plotting program
- lat, lon, zvar!
- -*- coding: utf-8 -*-
from   mpl_toolkits.basemap import Basemap, cm
import matplotlib.pyplot as plt
from   netCDF4 import Dataset as open_ncfile
import numpy as np
- preprocess with GMT 5.4
- gmt grdcut tk7_gauss1.nc -Gwest_europe_tk7.nc -R-10/50/30/60
- netcdf infile name, variable names
- lon, lat, z vars
infilename='./data_result/result.nc'
zvarlabel='TS'
latvarlabel='lat'
lonvarlabel='lon'
- labels
legtitle="T July avg.°C (21000 BP, CCSM3)"
plottitle="Temperature of July (21000 BP, Trace21ka CCSM3 )"
- output
outimage="./plotz/out.svg"
- outpdf="out.pdf"
- cmap
kolormap='jet'
- kolormap='Spectral_r'
- kolormap='gist_rainbow_r'
- kolormap='rainbow'
- cmap min, max
zeta=-15
zetb=25
lona=-15
lonb=40
lata=30
latb=70


latdx=5
londy=5
deltazc=1.5
deltazd=5
dpi = 70
- -- open netcdf file
nc = open_ncfile(infilename)
var = nc.variables[zvarlabel][:,:]
var2=np.flipud(var)


lat = nc.variables[latvarlabel][:]
lon = nc.variables[lonvarlabel][:]
- -- create figure and axes instances
fig = plt.figure(figsize=(1100/dpi, 1100/dpi), dpi=dpi)
ax  = fig.add_axes([0.1,0.1,0.8,0.9])
- map = Basemap(projection='cyl',llcrnrlat=lata,urcrnrlat= latb,\
- resolution='h', llcrnrlon=lona,urcrnrlon=lonb)
map = Basemap(projection='cyl',llcrnrlat=lata,urcrnrlat= latb,\
resolution='h',  llcrnrlon=lona,urcrnrlon=lonb)
map.drawcoastlines(color='darkblue')
map.drawrivers(color='blue')
- map.drawstates()
- map.drawcountries()
- kolorado=('black','black','black','black','black','black','black','black','black','black','black','black','black','black','black','black')
kolorado=( (0.0, 0.0, 0.5),(0.0, 0.0, 0.5),(0.0, 0.0, 0.5),(0.0, 0.0, 0.5), (0.0, 0.0, 0.5),(0.0, 0.0, 0.5),(0.0, 0.0, 0.5),(0.0, 0.0, 0.5))


map.drawparallels(np.arange(lata, latb,latdx),labels=[1,0,0,0],fontsize=20)
map.drawmeridians(np.arange(lona,lonb,londy),labels=[0,0,0,1],fontsize=20)
x, y = map(*np.meshgrid(lon,lat))


clevs = np.arange(zeta,zetb,deltazc)
dlevs = np.arange(zeta,zetb,deltazd)
- xx, yy = np.meshgrid(lon, lat)
- map.pcolormesh(xx, yy, var)
maplot1=map.imshow(var2, cmap=kolormap, vmin=zeta, vmax=zetb)
plt.rc('lines', linewidth=0.5, color='#000000')
cnplot = map.contour(x,y,var,dlevs,colors=kolorado)
- cnplot = map.contour(x,y,var,dlevs,colors='k')
cbar = map.colorbar(maplot1,location='bottom',pad="10%", label='T avg July oC')
cbar.set_label(legtitle, fontsize=20)
cbar.ax.tick_params(labelsize=16)
plt.clabel(cnplot, fmt='%.0f',fontsize=15, inline=1)
plt.title(plottitle, fontsize=24)
- plt.show()
plt.savefig(outimage, bbox_inches='tight', dpi=dpi)
plt.savefig(outpdf, bbox_inches='tight', dpi=dpi)
Licensing
[edit]
- You are free:
- to share – to copy, distribute and transmit the work
- to remix – to adapt the work
- Under the following conditions:
- attribution – You must give appropriate credit, provide a link to the license, and indicate if changes were made. You may do so in any reasonable manner, but not in any way that suggests the licensor endorses you or your use.
- share alike – If you remix, transform, or build upon the material, you must distribute your contributions under the same or compatible license as the original.
File history
Click on a date/time to view the file as it appeared at that time.
| Date/Time | Thumbnail | Dimensions | User | Comment | |
|---|---|---|---|---|---|
| current | 06:17, 18 September 2019 | | 1,236 × 1,052 (12.54 MB) | Merikanto (talk | contribs) | Orography update |
| 09:49, 3 September 2019 |  | 1,236 × 1,052 (11.89 MB) | Merikanto (talk | contribs) | Downscaling was wrong | |
| 15:33, 31 August 2019 |  | 1,236 × 1,052 (9.98 MB) | Merikanto (talk | contribs) | User created page with UploadWizard |
You cannot overwrite this file.
File usage on Commons
There are no pages that use this file.