File:Bruttoinlandsprodukt Deutschland - Verwendung 2013.svg
Jump to navigation
Jump to search

Size of this PNG preview of this SVG file: 800 × 477 pixels. Other resolutions: 320 × 191 pixels | 640 × 382 pixels | 1,024 × 610 pixels | 1,280 × 763 pixels | 2,560 × 1,526 pixels | 832 × 496 pixels.
Original file (SVG file, nominally 832 × 496 pixels, file size: 31 KB)
Captions
Captions
Add a one-line explanation of what this file represents
Summary
[edit]
| Description |
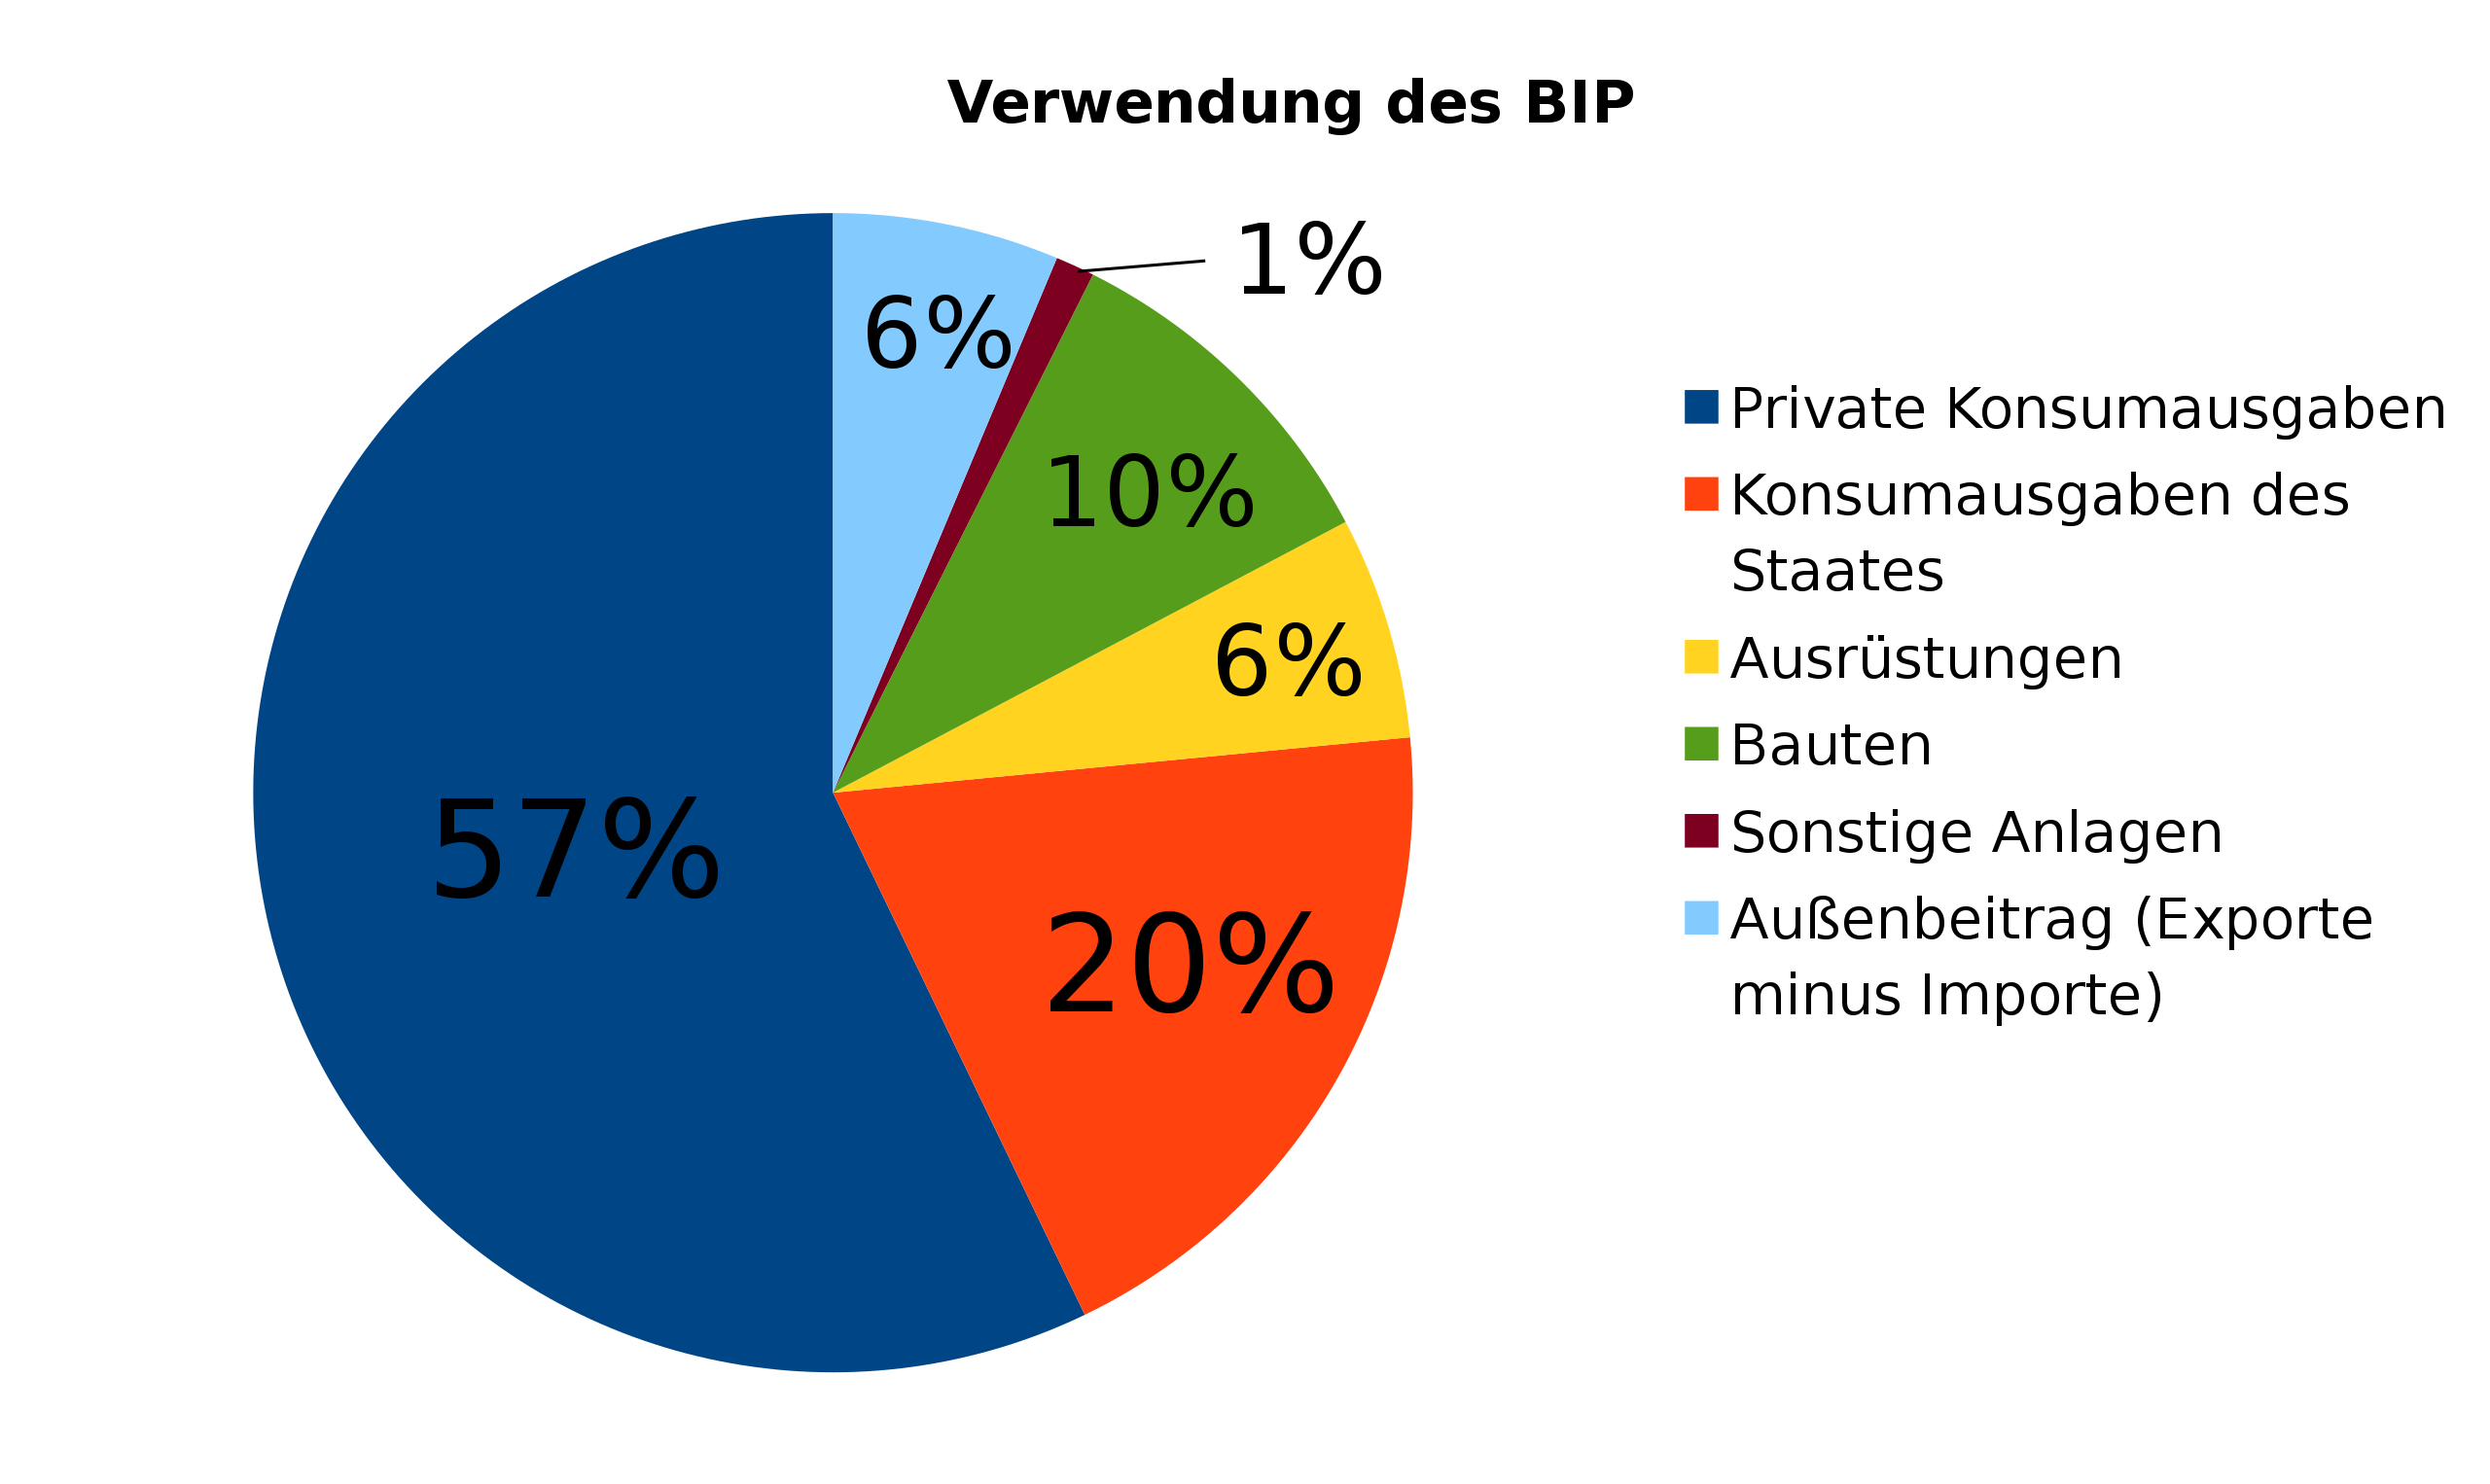
English: The diagrams shows the percentual usage of the GDP in Germany of 2013.
Deutsch: Das Diagramm zeigt die prozentuale Verwendung des Bruttoinlandsprodukt in Deutschland im Jahre 2013. |
| Date | |
| Source | Own work Daten vom Statistischem Bundesamt: https://www.destatis.de/DE/ZahlenFakten/GesamtwirtschaftUmwelt/VGR/Inlandsprodukt/Tabellen/Gesamtwirtschaft.html?nn=50700 |
| Author | Henri97 |
| SVG development | This W3C-invalid chart was created with OpenOffice.org. |
Licensing
[edit]
I, the copyright holder of this work, hereby publish it under the following licenses:

|
Permission is granted to copy, distribute and/or modify this document under the terms of the GNU Free Documentation License, Version 1.2 or any later version published by the Free Software Foundation; with no Invariant Sections, no Front-Cover Texts, and no Back-Cover Texts. A copy of the license is included in the section entitled GNU Free Documentation License. |
This file is licensed under the Creative Commons Attribution-Share Alike 3.0 Unported, 2.5 Generic, 2.0 Generic and 1.0 Generic license.
- You are free:
- to share – to copy, distribute and transmit the work
- to remix – to adapt the work
- Under the following conditions:
- attribution – You must give appropriate credit, provide a link to the license, and indicate if changes were made. You may do so in any reasonable manner, but not in any way that suggests the licensor endorses you or your use.
- share alike – If you remix, transform, or build upon the material, you must distribute your contributions under the same or compatible license as the original.
You may select the license of your choice.
File history
Click on a date/time to view the file as it appeared at that time.
| Date/Time | Thumbnail | Dimensions | User | Comment | |
|---|---|---|---|---|---|
| current | 22:05, 28 February 2014 | | 832 × 496 (31 KB) | Henri97 (talk | contribs) | {{Information |Description ={{en|1=The diagrams shows the percentual usage of the GDP in Germany of 2013.}} {{de|1=Das Diagramm zeigt die prozentuale Verwendung des Bruttoinlandsprodukt in Deutschland im Jahre 2013.}} |Source ={{own}} Daten... |
You cannot overwrite this file.
File usage on Commons
There are no pages that use this file.