File:Brottsstatistik urval.png
Jump to navigation
Jump to search

Size of this preview: 800 × 544 pixels. Other resolutions: 320 × 218 pixels | 640 × 435 pixels | 870 × 592 pixels.
Original file (870 × 592 pixels, file size: 109 KB, MIME type: image/png)
Captions
Captions
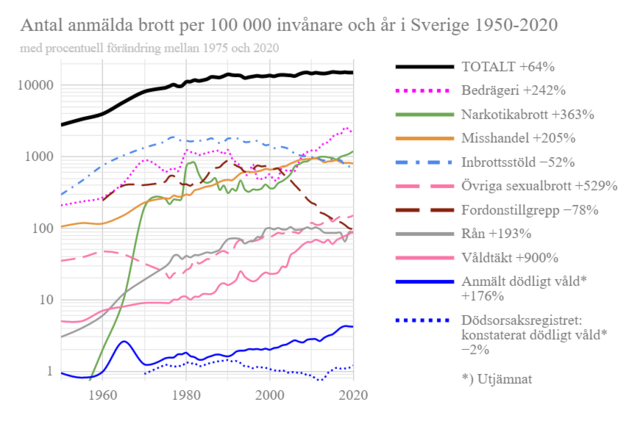
Number of crimes reported per 100,000 population and year in Sweden, 1950-2018, totally and for some crime types (in Swedish)
Summary
[edit]
| Description |
English: Relative number of crimes reported per 100,000 population in Sweden, 1950-2018, totally and for some crime types. In Swedish. The increase in percent since 1975 of the relative numbers are indicated in the legend. Logarithmic vertical axis. Based on the crime categorization by the Swedish National Council for Crime Prevention (Swedish: Brottsförebyggande rådet, abbreviated Brå). The legend is in descending order based on the crime frequency in 2018. Data sources:
Note that the number of suspected murders reported to the police later were classified as accidents or suicides by the police and in the death cause register. BRÅ introduced a quantization error by rounding to nearest integer, causing especially the murder curve to be jerky, but I recalculated the values based on Swedish population, and also smoothed the murder curves using 3 year moving average.) Inspired by File:Number_of_crimes_reported_per_100,000_population_in_Sweden,_1993-2013.svg made by user:Gavlesson. |
| Date | |
| Source | Own work |
| Author | Tomastvivlaren |
Licensing
[edit]
I, the copyright holder of this work, hereby publish it under the following license:
This file is licensed under the Creative Commons Attribution-Share Alike 4.0 International license.
- You are free:
- to share – to copy, distribute and transmit the work
- to remix – to adapt the work
- Under the following conditions:
- attribution – You must give appropriate credit, provide a link to the license, and indicate if changes were made. You may do so in any reasonable manner, but not in any way that suggests the licensor endorses you or your use.
- share alike – If you remix, transform, or build upon the material, you must distribute your contributions under the same or compatible license as the original.

|
This graph image could be re-created using vector graphics as an SVG file. This has several advantages; see Commons:Media for cleanup for more information. If an SVG form of this image is available, please upload it and afterwards replace this template with
{{vector version available|new image name}}.
It is recommended to name the SVG file “Brottsstatistik urval.svg”—then the template Vector version available (or Vva) does not need the new image name parameter. |
File history
Click on a date/time to view the file as it appeared at that time.
| Date/Time | Thumbnail | Dimensions | User | Comment | |
|---|---|---|---|---|---|
| current | 18:31, 30 August 2021 | | 870 × 592 (109 KB) | Tomastvivlaren (talk | contribs) | Minor adjustment |
| 17:36, 30 August 2021 |  | 696 × 474 (65 KB) | Tomastvivlaren (talk | contribs) | New statistics for 2019 and partly 2020 | |
| 16:38, 30 August 2021 |  | 870 × 592 (113 KB) | Tomastvivlaren (talk | contribs) | Changed one incorrect number. Still data från 1950-2018. | |
| 15:53, 1 November 2019 |  | 696 × 474 (56 KB) | Tomastvivlaren (talk | contribs) | Added confirmed number of deaths due to fatal violience - number of reported murders later were classified as accidents or suicides. Removed vandalism - too messy plot. | |
| 12:38, 26 June 2019 |  | 696 × 379 (62 KB) | Tomastvivlaren (talk | contribs) | Changed colors | |
| 12:32, 26 June 2019 |  | 696 × 379 (62 KB) | Tomastvivlaren (talk | contribs) | Changed curve colors and dashing | |
| 11:35, 26 June 2019 |  | 696 × 379 (62 KB) | Tomastvivlaren (talk | contribs) | Added one curve | |
| 17:19, 23 June 2019 |  | 770 × 408 (62 KB) | Tomastvivlaren (talk | contribs) | Improved smoothing of murder curve (limited to quantization interval) | |
| 17:00, 23 June 2019 |  | 739 × 408 (59 KB) | Tomastvivlaren (talk | contribs) | Changed selection of crime types. Sumarized all car crimes. To reduce the jerkiness of the murder curve, caused by the quantization to nearest integer, it was smoothed using a moving average of three equally weighted values. | |
| 09:55, 23 June 2019 |  | 707 × 426 (57 KB) | Tomastvivlaren (talk | contribs) | Changed dimensions |
You cannot overwrite this file.
File usage on Commons
There are no pages that use this file.
File usage on other wikis
The following other wikis use this file: