File:Bank Common Equity to Assets Ratios 2004 - 2008.png
Original file (960 × 720 pixels, file size: 12 KB, MIME type: image/png)
Captions
Captions
Summary
[edit]
| Description |
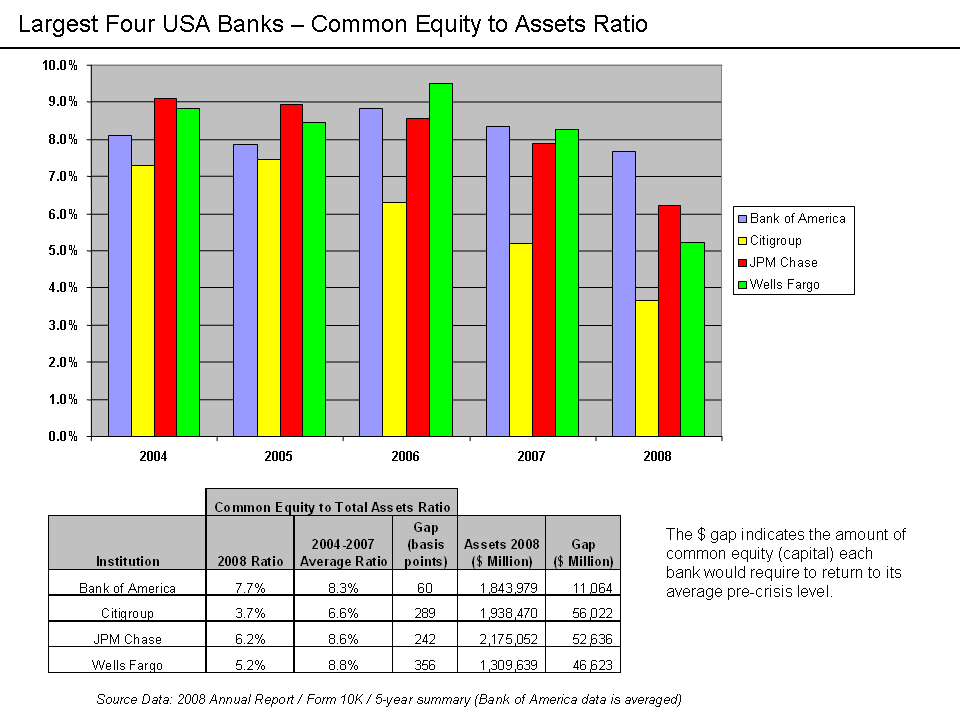
English: Common Equity to Total Assets Ratios for major U.S. banks Source DataThe source data is from the 2008 annual reports of each company available on their website. There is a five year annual summary that contains the source data used. Note that Bank of America (unlike the others) averages its numbers. A basis point is 1/100th of a percentage point. The concept of the gap analysis is to indicate how much additional common stock equity each bank would have to acquire to return to its 2004-2007 average ratio. Computation steps:
The amounts are in millions. For example, Wells Fargo would require $46.6 billion to return to its pre-crisis level of common equity capitalization. Alan Greenspan wrote in a March 2009 article that U.S. banks would require another $850 billion in his estimation, representing "an additional 3-4 percentage points of cushion in their equity capital to assets ratios."[1] |
| Date | |
| Source | Annual Reports of each entity |
| Author | Farcaster (talk) 05:12, 4 May 2009 (UTC) |
Licensing
[edit]
- You are free:
- to share – to copy, distribute and transmit the work
- to remix – to adapt the work
- Under the following conditions:
- attribution – You must give appropriate credit, provide a link to the license, and indicate if changes were made. You may do so in any reasonable manner, but not in any way that suggests the licensor endorses you or your use.
- share alike – If you remix, transform, or build upon the material, you must distribute your contributions under the same or compatible license as the original.

|
Permission is granted to copy, distribute and/or modify this document under the terms of the GNU Free Documentation License, Version 1.2 or any later version published by the Free Software Foundation; with no Invariant Sections, no Front-Cover Texts, and no Back-Cover Texts. A copy of the license is included in the section entitled GNU Free Documentation License. |
Original upload log
[edit]
- 2009-05-04 05:12 Farcaster 960×720× (12704 bytes) {{Information |Description = Common Equity to Total Assets Ratios for major U.S. banks |Source = Annual Reports of each entity |Date = May 4, 2009 |Author = ~~~~ |other_versions = }}
File history
Click on a date/time to view the file as it appeared at that time.
| Date/Time | Thumbnail | Dimensions | User | Comment | |
|---|---|---|---|---|---|
| current | 01:11, 14 October 2010 | | 960 × 720 (12 KB) | Hideokun (talk | contribs) | {{Information |Description={{en|Common Equity to Total Assets Ratios for major U.S. banks<br/> ==Source Data== The source data is from the 2008 annual reports of each company available on their website. There is a five year annual summary that contains th |
You cannot overwrite this file.
File usage on Commons
There are no pages that use this file.
File usage on other wikis
The following other wikis use this file:
- Usage on en.wikipedia.org
- Usage on hi.wikipedia.org
- Usage on ja.wikipedia.org
- Usage on ta.wikipedia.org