File:Appleoutput-fr.png
Jump to navigation
Jump to search
Size of this preview: 800 × 480 pixels. Other resolutions: 320 × 192 pixels | 1,024 × 614 pixels | 1,600 × 960 pixels.
Original file (1,600 × 960 pixels, file size: 473 KB, MIME type: image/png)
Captions
Captions
Add a one-line explanation of what this file represents
| Description |
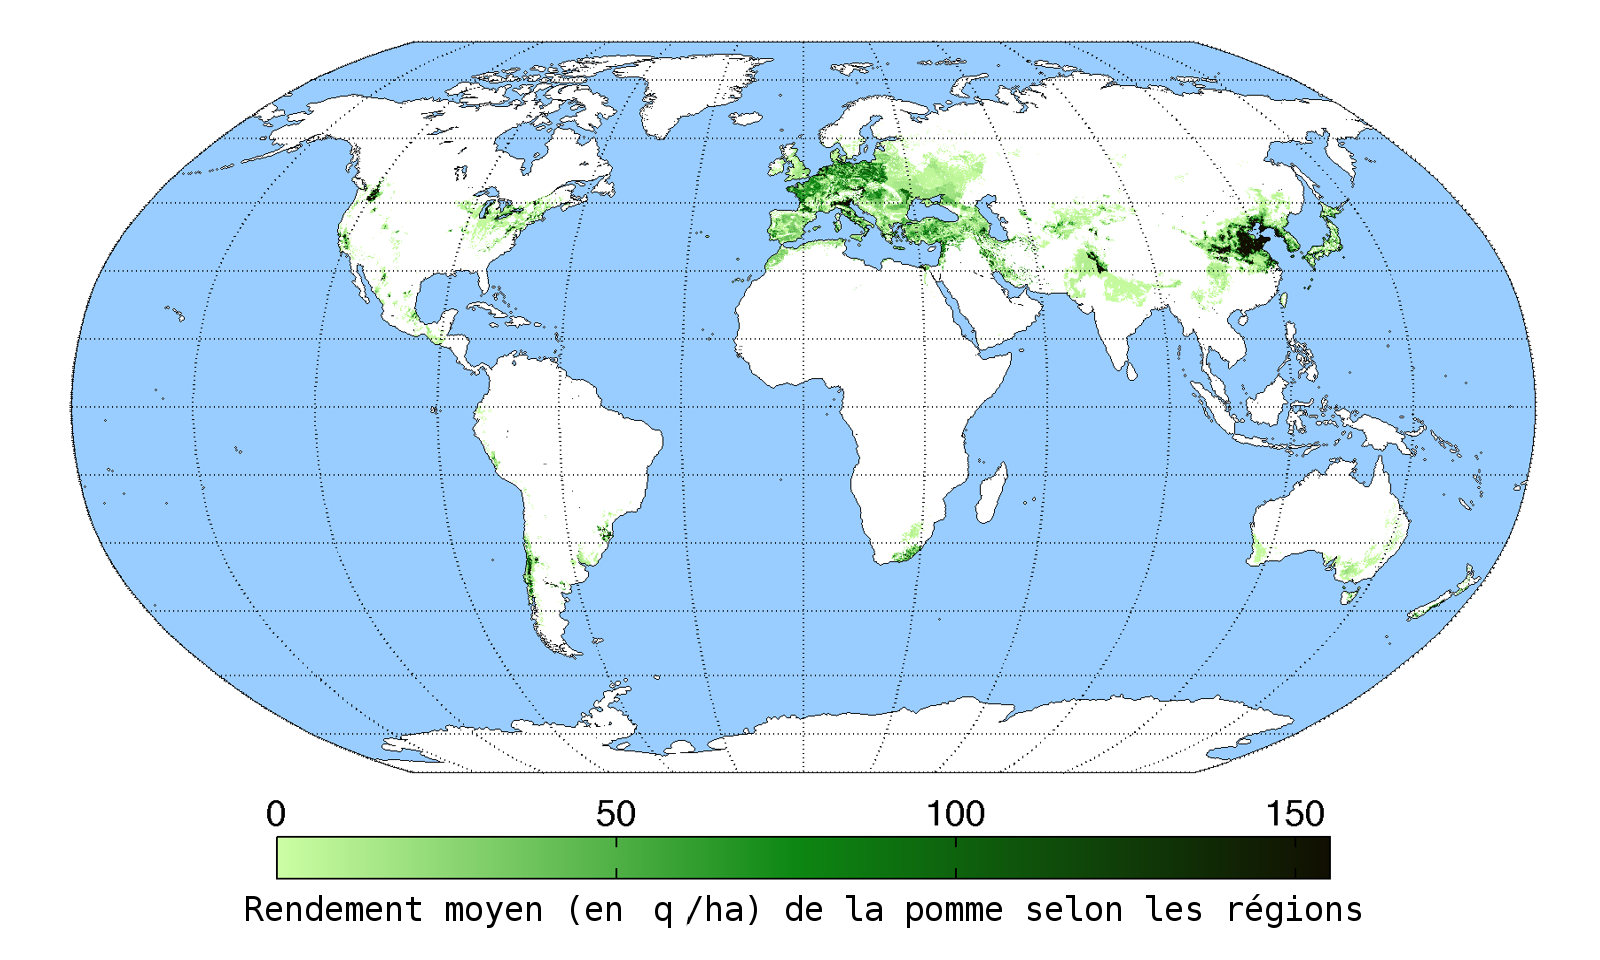
English: Map of apple production (average percentage of land used for its production times average yield in each grid cell) across the world compiled by the University of Minnesota Institute on the Environment with data from: Monfreda, C., N. Ramankutty, and J.A. Foley. 2008. Farming the planet: 2. Geographic distribution of crop areas, yields, physiological types, and net primary production in the year 2000. Global Biogeochemical Cycles 22: GB1022
Français : rendement moyen (en q/ha) de la pomme selon les régions du globe terrestre en l'an 2000 (étude Farming the planet de Monfreda et coll., dans Global Biogochimical Cycles, Vol. 22, 2008) |
| Date | (UTC) |
| Source | |
| Author |
|
| This is a retouched picture, which means that it has been digitally altered from its original version. Modifications: french traduction. The original can be viewed here: Appleoutput.png:
|
I, the copyright holder of this work, hereby publish it under the following license:
This file is licensed under the Creative Commons Attribution 3.0 Unported license.
- You are free:
- to share – to copy, distribute and transmit the work
- to remix – to adapt the work
- Under the following conditions:
- attribution – You must give appropriate credit, provide a link to the license, and indicate if changes were made. You may do so in any reasonable manner, but not in any way that suggests the licensor endorses you or your use.
Original upload log[edit]
This image is a derivative work of the following images:
- File:Appleoutput.png licensed with Cc-by-3.0
- 2010-06-02T20:09:12Z AndrewMT 1600x960 (495236 Bytes) {{Information |Description={{en|1=Map of apple production (average percentage of land used for its production times average yield in each grid cell) across the world compiled by the University of Minnesota Institute on the En
Uploaded with derivativeFX
File history
Click on a date/time to view the file as it appeared at that time.
| Date/Time | Thumbnail | Dimensions | User | Comment | |
|---|---|---|---|---|---|
| current | 15:57, 2 March 2011 | | 1,600 × 960 (473 KB) | Le sourcier de la colline (talk | contribs) | Correction de: (kg/h) en (q/h). |
| 15:38, 17 November 2010 |  | 1,600 × 960 (521 KB) | Leovilok (talk | contribs) | {{Information |Description={{en|1=Map of apple production (average percentage of land used for its production times average yield in each grid cell) across the world compiled by the University of Minnesota Institute on the Environment with data from: Monf |
You cannot overwrite this file.
File usage on Commons
The following page uses this file:
File usage on other wikis
The following other wikis use this file:
- Usage on fr.wikipedia.org