File:Annotated Skew T diagram.png
Jump to navigation
Jump to search
Size of this preview: 720 × 600 pixels. Other resolutions: 288 × 240 pixels | 576 × 480 pixels | 864 × 720 pixels.
Original file (864 × 720 pixels, file size: 97 KB, MIME type: image/png)
Captions
Captions
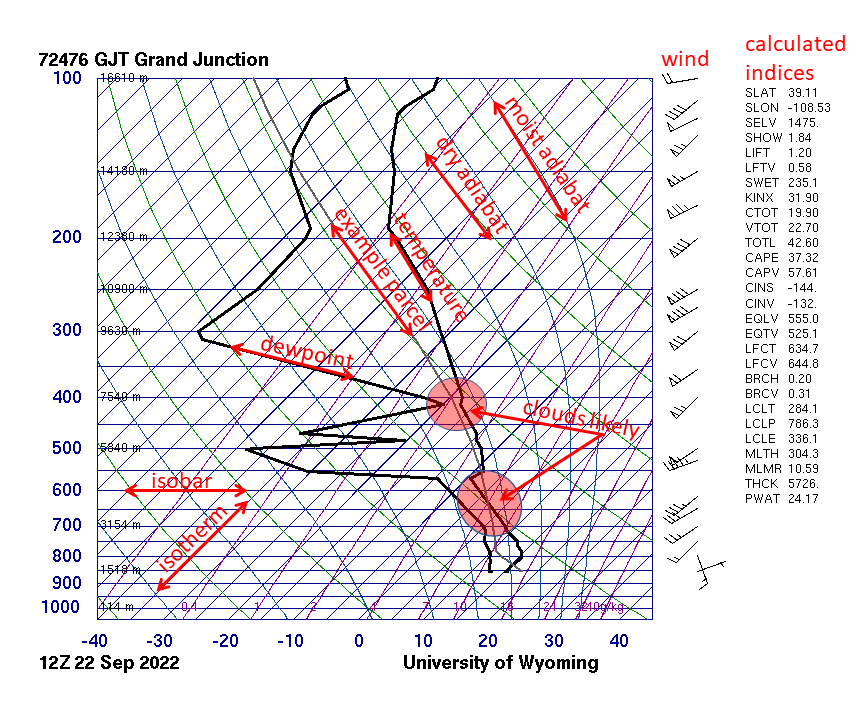
Skew T diagrams can suggest where and what type of clouds are present.
Summary[edit]
| Description |
English: The altitude of clouds can be partially inferred by high relative humidity, where the dewpoint and temperature are close. The type of cloud is suggested by the stability of the atmosphere, determined by the steepness of the temperature profile compared to the adiabatic lapse rate. The underlying graph was downloaded from the University of Wyoming atmospheric soundings archive, http://weather.uwyo.edu/upperair/sounding.html. |
| Date | |
| Source | Own work |
| Author | JeanBizHertzberg |
Licensing[edit]
I, the copyright holder of this work, hereby publish it under the following license:
This file is licensed under the Creative Commons Attribution-Share Alike 4.0 International license.
- You are free:
- to share – to copy, distribute and transmit the work
- to remix – to adapt the work
- Under the following conditions:
- attribution – You must give appropriate credit, provide a link to the license, and indicate if changes were made. You may do so in any reasonable manner, but not in any way that suggests the licensor endorses you or your use.
- share alike – If you remix, transform, or build upon the material, you must distribute your contributions under the same or compatible license as the original.
File history
Click on a date/time to view the file as it appeared at that time.
| Date/Time | Thumbnail | Dimensions | User | Comment | |
|---|---|---|---|---|---|
| current | 23:47, 27 October 2022 | | 864 × 720 (97 KB) | JeanBizHertzberg (talk | contribs) | Uploaded own work with UploadWizard |
You cannot overwrite this file.
File usage on Commons
The following page uses this file:
File usage on other wikis
The following other wikis use this file:
- Usage on en.wikipedia.org
- Usage on fr.wikipedia.org
- Usage on ig.wikipedia.org
- Usage on ko.wikipedia.org
- Usage on www.wikidata.org