File:Actual versus predicted tsunami height MLIT.jpg
Jump to navigation
Jump to search

Size of this preview: 800 × 453 pixels. Other resolutions: 320 × 181 pixels | 640 × 362 pixels | 1,024 × 580 pixels | 1,280 × 724 pixels | 2,396 × 1,356 pixels.
Original file (2,396 × 1,356 pixels, file size: 636 KB, MIME type: image/jpeg)
Captions
Captions
Add a one-line explanation of what this file represents
Summary[edit]
| Description |
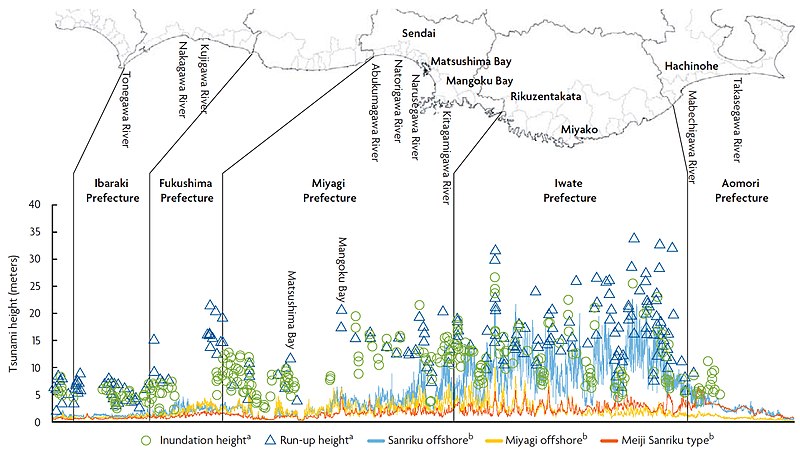
English: Source: Junko Sagara, Keiko Saito: "Risk Assessment and Hazard Mapping", in: Federica Ranghieri, Mikio Ishiwatari (editors): Learning from Megadisasters - Lessons from the Great East Japan Earthquake, World Bank Publications, Washington, DC, 2014, ISBN (paper): 978-1-4648-0153-2, ISBN (electronic): 978-1-4648-0154-9, DOI: 10.1596/978-1-4648-0153-2, Chapter 25, pp. 223-231, here: p. 227, "Map 25.5 Actual versus predicted tsunami height - Source: Ministry of Land, Infrastructure, Transport and Tourism (MLIT). - a. Actual records on March 11, 2011. b. Simulation results before GEJE."). License: Creative Commons Attribution CC BY 3.0 IGO.
Context in the mentioned source: "As illustrated in map 25.2, the March 11 earthquake had a very large epicentral and tsunami source area, larger than any earthquake recorded in Japan’s history. Furthermore, its magnitude of Mw (moment magnitude) 9.0 exceeded the hazard level of any earthquake in the country ever considered for purposes of disaster management. Thus, the extent of the high seismic intensity area of the actual earthquake was much larger than expected, and the area that experienced Japanese seismic intensity of 5+ or larger was about 10 times the estimate (map 25.4). Furthermore, the actual tsunami height was twice the height used in the predisaster tsunami hazard predictions (map 25.5). |
| Date | |
| Source | Junko Sagara, Keiko Saito: "Risk Assessment and Hazard Mapping", in: Federica Ranghieri, Mikio Ishiwatari (editors): Learning from Megadisasters - Lessons from the Great East Japan Earthquake, World Bank Publications, Washington, DC, 2014, ISBN (paper): 978-1-4648-0153-2, ISBN (electronic): 978-1-4648-0154-9, DOI: 10.1596/978-1-4648-0153-2, Chapter 25, pp. 223-231, here: p. 227, "Map 25.5 Actual versus predicted tsunami height - Source: Ministry of Land, Infrastructure, Transport and Tourism (MLIT). - a. Actual records on March 11, 2011. b. Simulation results before GEJE."). License: Creative Commons Attribution CC BY 3.0 IGO. |
| Author | Ministry of Land, Infrastructure, Transport and Tourism (MLIT) (Japan) |
| Permission (Reusing this file) |
This file is licensed under the Creative Commons Attribution 3.0 IGO license.
|
File history
Click on a date/time to view the file as it appeared at that time.
| Date/Time | Thumbnail | Dimensions | User | Comment | |
|---|---|---|---|---|---|
| current | 11:19, 27 May 2018 | | 2,396 × 1,356 (636 KB) | Anglo-Araneophilus~commonswiki (talk | contribs) | {{Information |description ={{en|1=Source: Junko Sagara, Keiko Saito: "Risk Assessment and Hazard Mapping", in: Federica Ranghieri, Mikio Ishiwatari (editors): Learning from Megadisasters - Lessons from the Great East Japan Earthquake, World Bank Publications, Washington, DC, 2014, ISBN (paper): 978-1-4648-0153-2, ISBN (electronic): 978-1-4648-0154-9, DOI: 10.1596/978-1-4648-0153-2, Chapter 25, pp. 223-231, here: p. 227, "Map 25.5 Actual versus predicted tsunami height - Source: Ministry o... |
You cannot overwrite this file.
File usage on Commons
There are no pages that use this file.
File usage on other wikis
The following other wikis use this file:
- Usage on de.wikipedia.org