File:20201210 Antarctica ice mass variation - NASA GRACE-en.svg
Jump to navigation
Jump to search

Size of this PNG preview of this SVG file: 800 × 600 pixels. Other resolutions: 320 × 240 pixels | 640 × 480 pixels | 1,024 × 768 pixels | 1,280 × 960 pixels | 2,560 × 1,920 pixels | 1,000 × 750 pixels.
Original file (SVG file, nominally 1,000 × 750 pixels, file size: 5 KB)
Captions
Captions
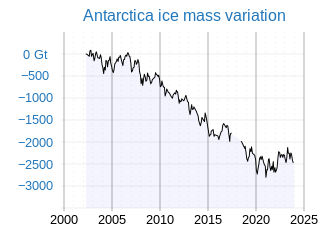
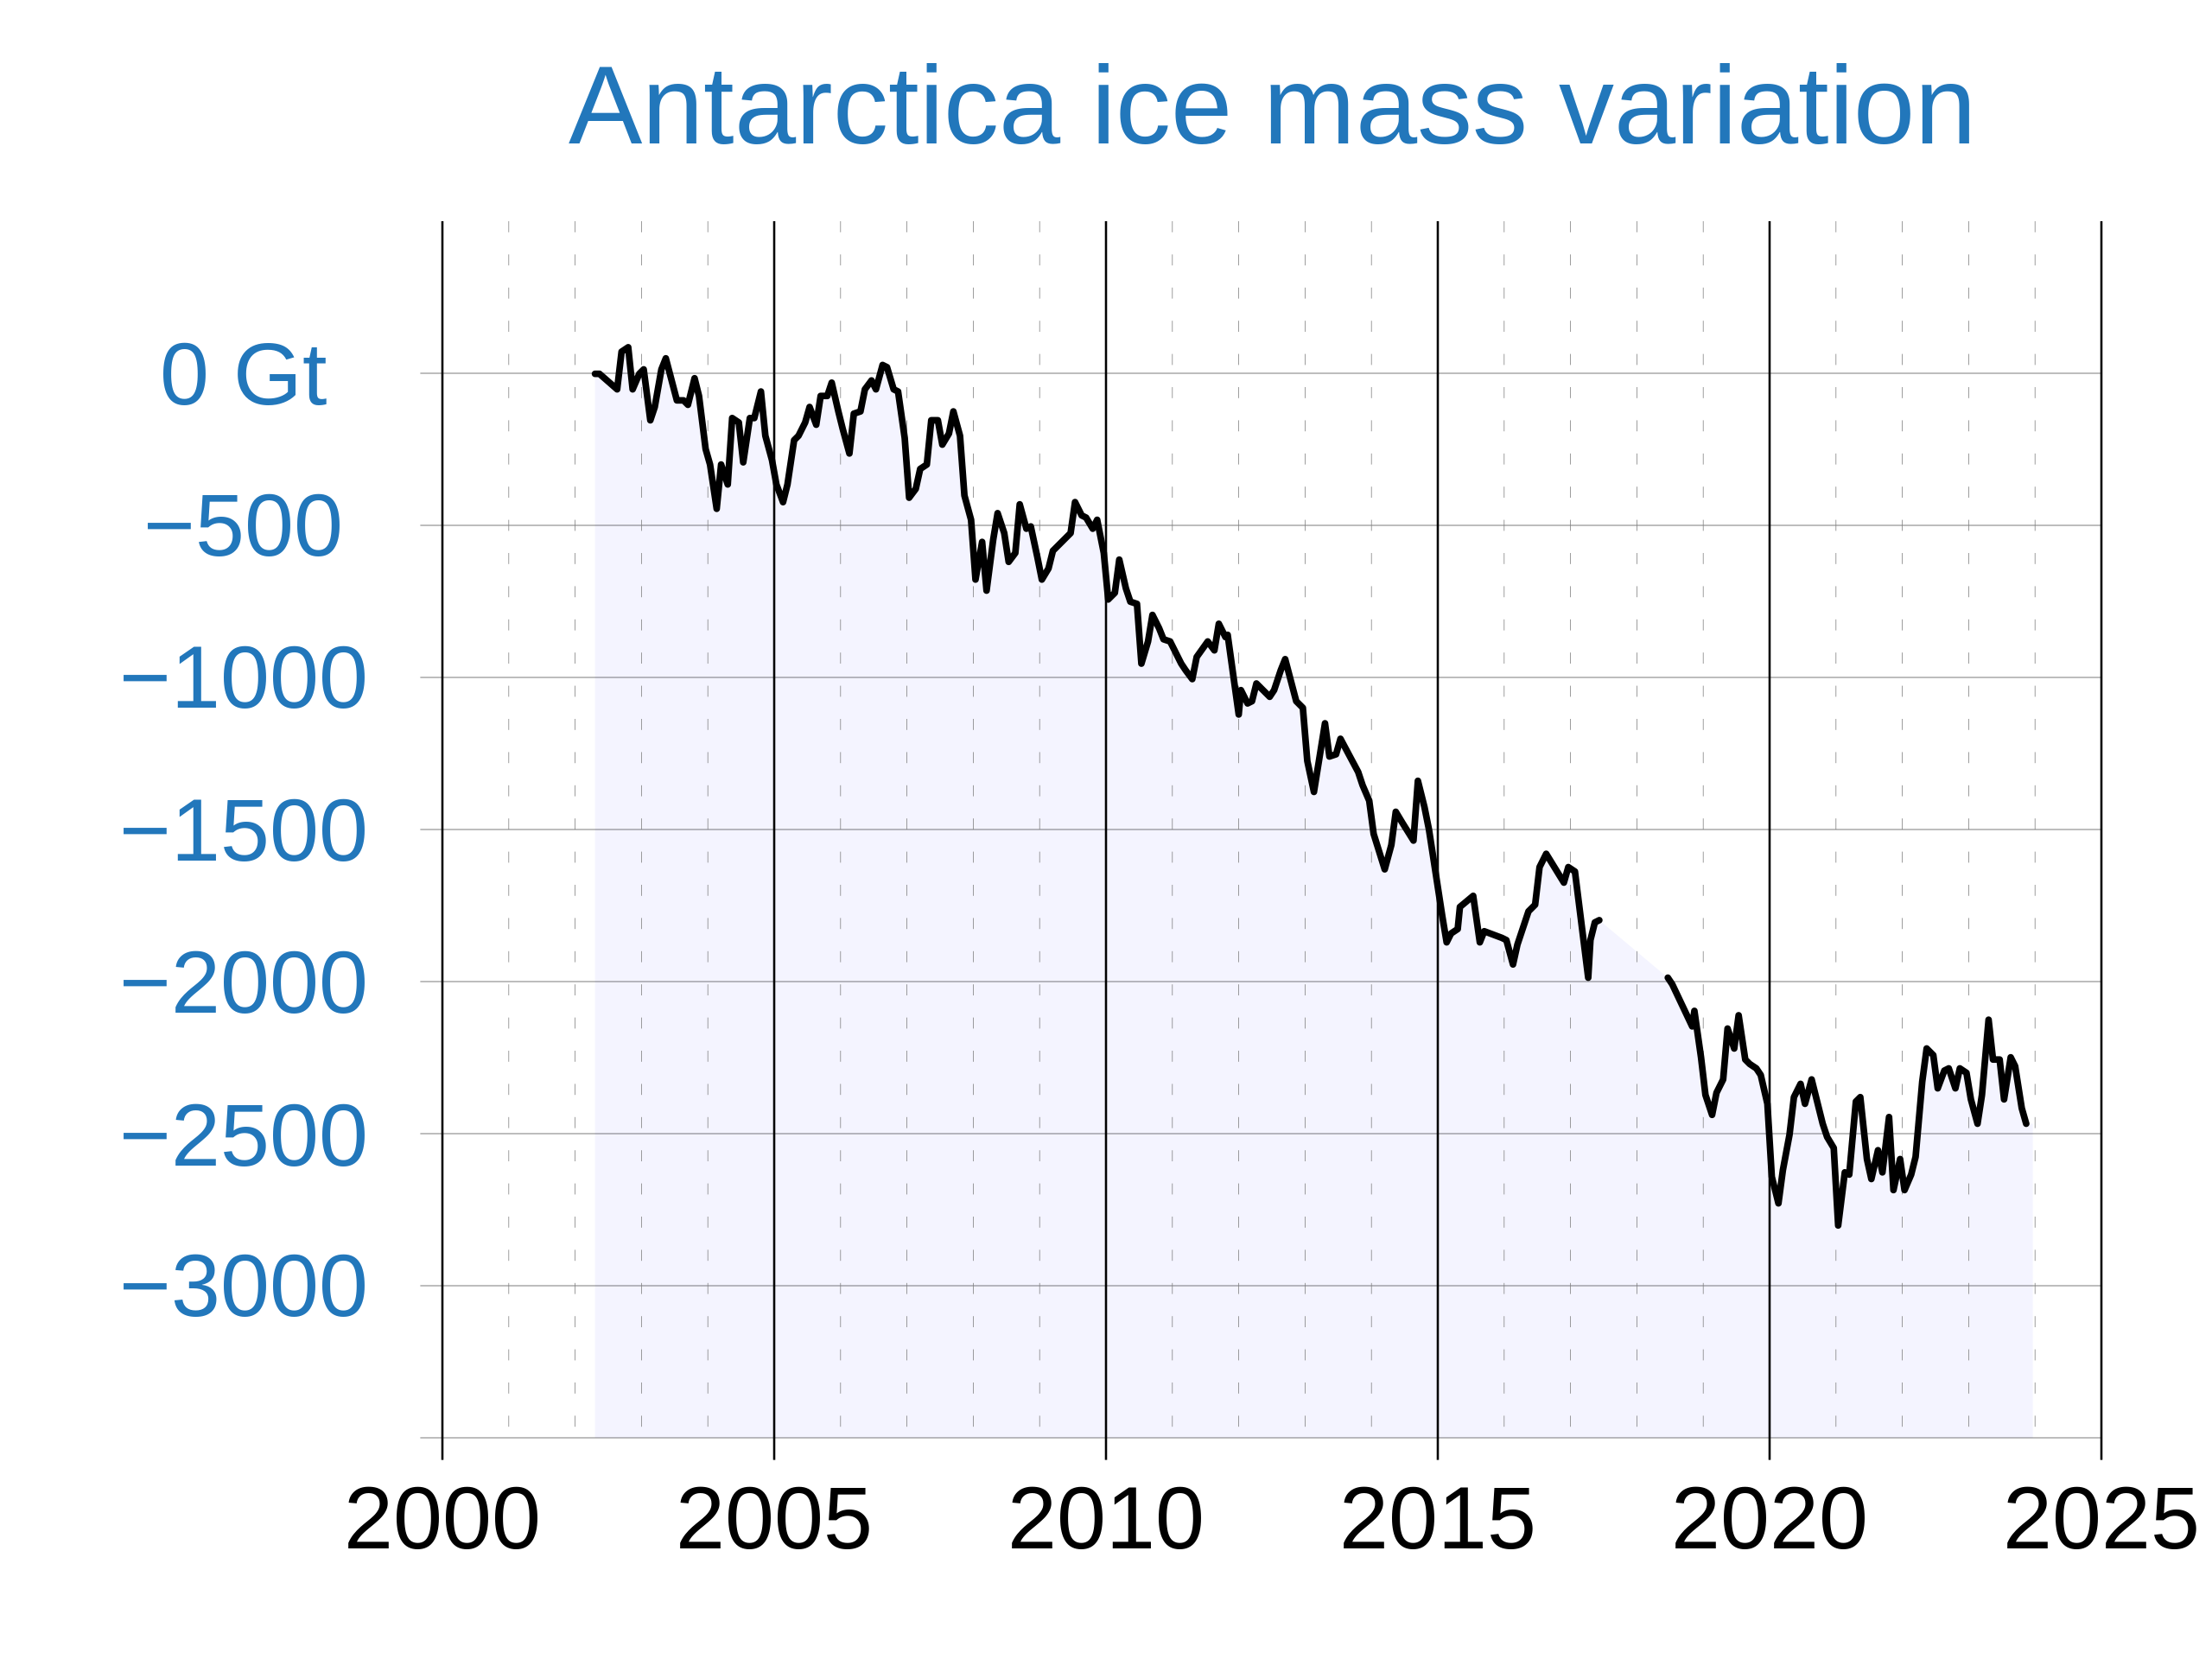
"Ice mass measurement by NASA's GRACE satellites. Gap represents time between missions. Credit: NASA"
Summary[edit]
| Description |
English: From source: "Ice mass measurement by NASA's GRACE satellites. Gap represents time between missions. Credit: NASA" (includes data from GRACE AND GRACE follow-on)
|
| Date | |
| Source |
|
| Author | Employee(s) of NASA, U.S. government, in the ordinary course of their employment duties. |
Licensing[edit]
1. For the NASA work:
| This file is in the public domain in the United States because it was solely created by NASA. NASA copyright policy states that "NASA material is not protected by copyright unless noted". (See Template:PD-USGov, NASA copyright policy page or JPL Image Use Policy.) | ||
 |
Warnings:
|
2. For uploader's SVG graphic:
I, the copyright holder of this work, hereby publish it under the following license:
This file is licensed under the Creative Commons Attribution-Share Alike 4.0 International license.
- You are free:
- to share – to copy, distribute and transmit the work
- to remix – to adapt the work
- Under the following conditions:
- attribution – You must give appropriate credit, provide a link to the license, and indicate if changes were made. You may do so in any reasonable manner, but not in any way that suggests the licensor endorses you or your use.
- share alike – If you remix, transform, or build upon the material, you must distribute your contributions under the same or compatible license as the original.
File history
Click on a date/time to view the file as it appeared at that time.
| Date/Time | Thumbnail | Dimensions | User | Comment | |
|---|---|---|---|---|---|
| current | 22:24, 29 March 2024 | | 1,000 × 750 (5 KB) | RCraig09 (talk | contribs) | Version 11: Updated with data through November 2023 |
| 04:13, 15 October 2023 |  | 1,000 × 750 (5 KB) | RCraig09 (talk | contribs) | Version 10: update through June 2023 data . . . . add light blue area beneath trace | |
| 00:07, 2 February 2023 |  | 1,000 × 750 (5 KB) | RCraig09 (talk | contribs) | Version 9: update to include data through late 2022 | |
| 18:32, 11 February 2022 |  | 1,000 × 750 (5 KB) | RCraig09 (talk | contribs) | Version 8: changed gridlines per Talk Page . . . Colored title | |
| 15:40, 9 February 2022 |  | 1,000 × 750 (49 KB) | Amitchell125 (talk | contribs) | thicker lines, text to path | |
| 06:16, 24 January 2022 |  | 1,000 × 750 (4 KB) | RCraig09 (talk | contribs) | Version 6: implement suggestions from Talk Page, but keeping file size small and svg code simple | |
| 11:36, 22 January 2022 |  | 958 × 685 (20 KB) | Femke (talk | contribs) | Hyphen -> minus signs. Remove various superfluous parts of graph, focussing on data | |
| 05:41, 22 January 2022 |  | 1,000 × 750 (5 KB) | RCraig09 (talk | contribs) | Version 4: update to include data for 2021 . . . . use spreadsheet (not Inkscape) to generate SVG code that's more optimized for smaller file size . . . enlarge plot area to future-proof through 2024 | |
| 13:33, 15 January 2022 |  | 840 × 630 (61 KB) | Amitchell125 (talk | contribs) | paths for objects | |
| 05:09, 20 February 2021 |  | 840 × 630 (24 KB) | RCraig09 (talk | contribs) | Version 2: changed background shading so graph area is white and border is opaque light-gray |
You cannot overwrite this file.
File usage on Commons
The following 24 pages use this file:
- User:4ing/Antarctica
- User:4ing/Antarctica/2020-07-12
- User:4ing/Antarctica/2021-01-06
- User:Magog the Ogre/Multilingual legend/2020 December 1-10
- User:Magog the Ogre/Multilingual legend/2021 February 19-28
- User:Magog the Ogre/Multilingual legend/2022 February 1-9
- User:Magog the Ogre/Multilingual legend/2022 February 10-18
- User:Magog the Ogre/Multilingual legend/2022 January 11-20
- User:Magog the Ogre/Multilingual legend/2022 January 21-31
- User:Magog the Ogre/Multilingual legend/2023 February 1-9
- User:Magog the Ogre/Multilingual legend/2023 October 13-16
- User:Magog the Ogre/Multilingual legend/2024 March 27-31
- User:RCraig09
- User:Triplec85-DE-BW-RPK-Landkreise-new-files/Rhein-Neckar-Kreis/2024 March
- User:Zwiadowca21/NewFiles/2020 December 1-10
- User:Zwiadowca21/NewFiles/2021 February 19-28
- User:Zwiadowca21/NewFiles/2022 February 1-9
- User:Zwiadowca21/NewFiles/2022 February 10-18
- User:Zwiadowca21/NewFiles/2022 January 11-20
- User:Zwiadowca21/NewFiles/2022 January 21-31
- User:Zwiadowca21/NewFiles/2023 February 1-9
- User:Zwiadowca21/NewFiles/2023 October 11-20
- User:Zwiadowca21/NewFiles/2024 March 21-31
- File:Greenland+Antarctica Mass Loss.png
File usage on other wikis
The following other wikis use this file:
- Usage on ar.wikipedia.org
- Usage on el.wikipedia.org
- Usage on en.wikipedia.org
- Usage on id.wikipedia.org
- Usage on mk.wikipedia.org
- Usage on sl.wikipedia.org
- Usage on zh.wikipedia.org