File:2019 Worldwide CO2 Emissions (by region, per capita), variwide chart.png

Original file (2,999 × 1,997 pixels, file size: 696 KB, MIME type: image/png)
Captions
Captions

|
This chart image could be re-created using vector graphics as an SVG file. This has several advantages; see Commons:Media for cleanup for more information. If an SVG form of this image is available, please upload it and afterwards replace this template with
{{vector version available|new image name}}.
It is recommended to name the SVG file “2019 Worldwide CO2 Emissions (by region, per capita), variwide chart.svg”—then the template Vector version available (or Vva) does not need the new image name parameter. |
Summary[edit]
,_variwide_chart.png&action=edit§ion=1)
| Description |
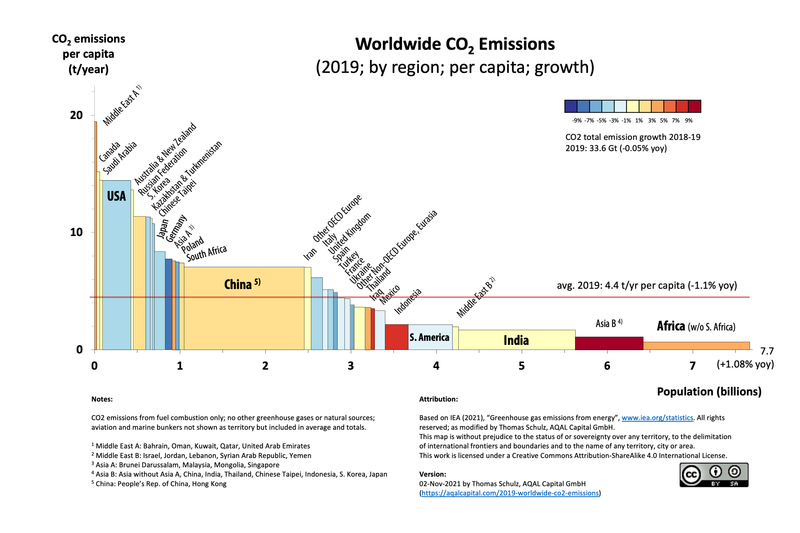
English: The variwide chart allows the visualization of a multitude of data dimensions in one easy-to-read diagram. These data dimensions are:
- Individual country data, such as China, South Africa, or the USA or a group of countries such as Middle East, Africa, or Australia/New Zealand, - Population by country or group of countries, - Per capita CO2 emissions, and - CO2 emissions growth year-over-year The total CO2 emissions of a region are represented as a rectangular area. The height of each rectangle is proportional to the CO2 emissions per capita and the width is proportional to the population of the represented region. The regions are sorted by CO2 emissions per capita, from the highest to the lowest. The color of the rectangles indicate their growth rate: “heating up” is represented from light red to dark red, and “cooling down” goes from light blue to dark blue. Based on IEA data from IEA (2021) “Greenhouse gas emissions from energy”, www.iea.org/statistics. All rights reserved; as modified by Thomas Schulz, AQAL Capital GmbH. https://aqalcapital.com/2019-worldwide-co2-emissions/ This map is without prejudice to the status of or sovereignty over any territory, to the delimitation of international frontiers and boundaries and to the name of any territory, city or area. License: This work is licensed under a Creative Commons Attribution-ShareAlike 4.0 International License (CC BY-SA 4.0) |
| Date | |
| Source | Own work |
| Author | Tom.schulz |
Licensing[edit]
,_variwide_chart.png&action=edit§ion=2)
- You are free:
- to share – to copy, distribute and transmit the work
- to remix – to adapt the work
- Under the following conditions:
- attribution – You must give appropriate credit, provide a link to the license, and indicate if changes were made. You may do so in any reasonable manner, but not in any way that suggests the licensor endorses you or your use.
- share alike – If you remix, transform, or build upon the material, you must distribute your contributions under the same or compatible license as the original.
File history
Click on a date/time to view the file as it appeared at that time.
| Date/Time | Thumbnail | Dimensions | User | Comment | |
|---|---|---|---|---|---|
| current | 18:26, 2 November 2021 | | 2,999 × 1,997 (696 KB) | Tom.schulz (talk | contribs) | Attribution corrected: IEA 2021, Greenhouse gas emissions from energy. |
| 17:23, 1 November 2021 |  | 2,999 × 1,997 (697 KB) | Tom.schulz (talk | contribs) | Cross-wiki upload from en.wikipedia.org |
You cannot overwrite this file.
File usage on Commons
There are no pages that use this file.
File usage on other wikis
The following other wikis use this file:
- Usage on bn.wikipedia.org
- Usage on fr.wikipedia.org
- Usage on tr.wikipedia.org
,_variwide_chart.png&oldid=771710787)