File:2017 US Tax Cuts and Jobs Act. Distribution of impact by income group.png
Original file (1,280 × 720 pixels, file size: 264 KB, MIME type: image/png)
Captions
Captions
Understanding the chart[edit]
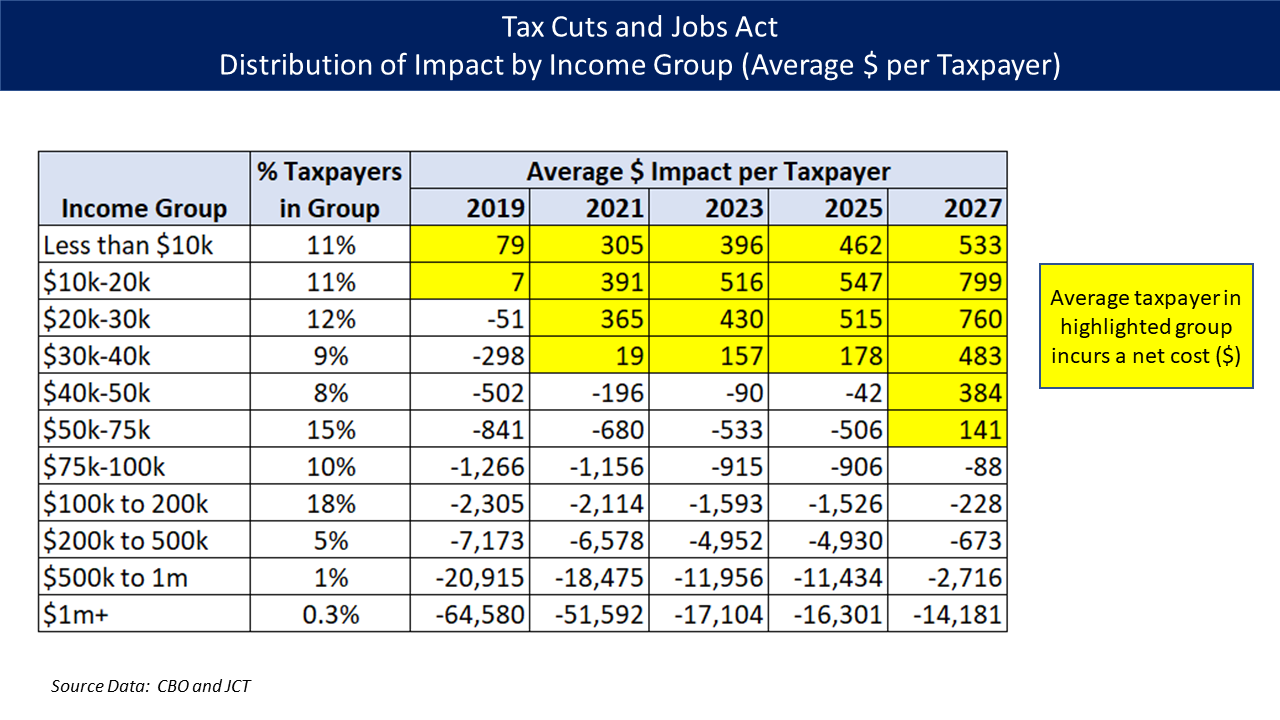
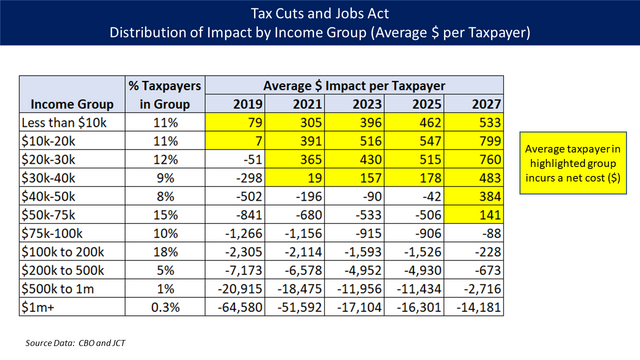
CBO and JCT estimate of the distribution of impact by income group (average dollars per taxpayer) under the Tax Cuts and Jobs Act. On average, taxpayers in the income groups highlighted in yellow will incur a net cost (shown as a positive figure as this reduces the budget deficit), mainly due to reduced healthcare subsidies. Higher income taxpayers receive a benefit via tax cuts (shown as a negative number as this increases the budget deficit). The percent of taxpayers in each income group is also shown for the 2023 period.
The CBO provided a total impact for each group as a whole in millions of dollars. The JCT provided the number of taxpayers in each group in thousands.[1] Dividing the CBO figure by the JCT figure and multiplying by 1,000 gives you the resulting dollar impact for the average taxpayer in the group, shown in each cell in the table.[2]
The term "taxpayer" in the chart refers to the more formal "tax filing unit" in the CBO and JCT studies. A tax filing unit is a tax return, meaning it could represent one person or a married couple filing jointly, among other options.
References[edit]
Summary[edit]
| Description |
English: Distribution of impact by income group (average dollars per taxpayer) under the Tax Cuts and Jobs Act |
| Date | |
| Source | Own work |
| Author | Farcaster |
Licensing[edit]
- You are free:
- to share – to copy, distribute and transmit the work
- to remix – to adapt the work
- Under the following conditions:
- attribution – You must give appropriate credit, provide a link to the license, and indicate if changes were made. You may do so in any reasonable manner, but not in any way that suggests the licensor endorses you or your use.
- share alike – If you remix, transform, or build upon the material, you must distribute your contributions under the same or compatible license as the original.
File history
Click on a date/time to view the file as it appeared at that time.
| Date/Time | Thumbnail | Dimensions | User | Comment | |
|---|---|---|---|---|---|
| current | 05:06, 29 December 2017 | | 1,280 × 720 (264 KB) | Farcaster (talk | contribs) | User created page with UploadWizard |
You cannot overwrite this file.
File usage on Commons
The following 2 pages use this file:
- User:Timeshifter
- File:1-Distribution of Impact per Taxpayer v1.png (file redirect)
File usage on other wikis
The following other wikis use this file:
- Usage on en.wikipedia.org
- Usage on ja.wikipedia.org