File:1851- U.S. landfall hurricanes by month.svg
Jump to navigation
Jump to search

Size of this PNG preview of this SVG file: 800 × 533 pixels. Other resolutions: 320 × 213 pixels | 640 × 427 pixels | 1,024 × 683 pixels | 1,280 × 853 pixels | 2,560 × 1,707 pixels.
Original file (SVG file, nominally 900 × 600 pixels, file size: 3 KB)
Captions
Captions
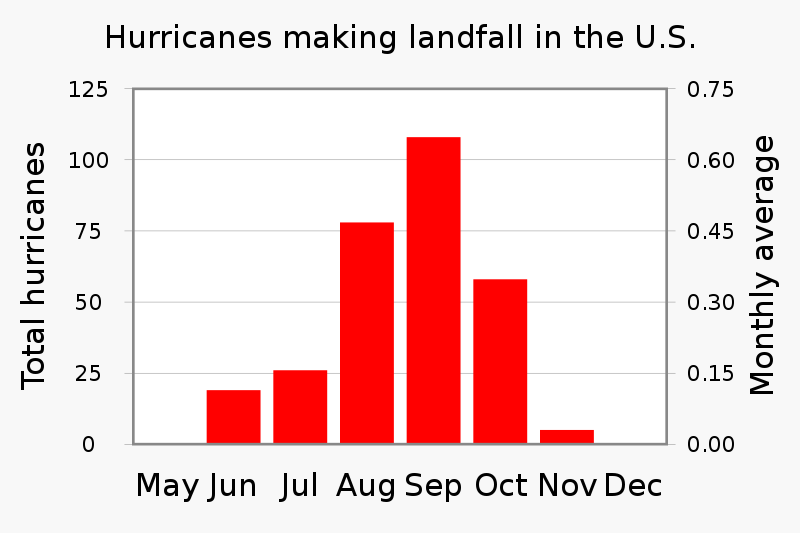
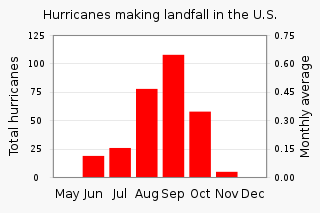
Graph of number of hurricanes making landfall in the United States, 1851-2018
Summary[edit]
| Description |
English: Graph of number of hurricanes making landfall in the United States, 1851-2018
Data source:
Month Total Avg
|
||
| Date | |||
| Source | Own work | ||
| Author | RCraig09 | ||
| SVG development |

Related images[edit]
-
 1851-2017 Atlantic hurricanes and tropical storms by month — uses same source as the above chart (PNG format)
 -
 1851-2017 Atlantic hurricanes and tropical storms by month — uses same source as the above chart (SVG format)


Licensing[edit]
I, the copyright holder of this work, hereby publish it under the following license:
This file is licensed under the Creative Commons Attribution-Share Alike 4.0 International license.
- You are free:
- to share – to copy, distribute and transmit the work
- to remix – to adapt the work
- Under the following conditions:
- attribution – You must give appropriate credit, provide a link to the license, and indicate if changes were made. You may do so in any reasonable manner, but not in any way that suggests the licensor endorses you or your use.
- share alike – If you remix, transform, or build upon the material, you must distribute your contributions under the same or compatible license as the original.
File history
Click on a date/time to view the file as it appeared at that time.
| Date/Time | Thumbnail | Dimensions | User | Comment | |
|---|---|---|---|---|---|
| current | 02:43, 16 May 2021 | | 900 × 600 (3 KB) | RCraig09 (talk | contribs) | Version TEN: Using Column Chart spreadsheet linked at User:RCraig09/Excel to XML for SVG to automatically generate XML code, to simplify code and reduce file size |
| 04:49, 6 March 2020 |  | 3,000 × 2,000 (35 KB) | RCraig09 (talk | contribs) | Version NINE: removed the flowroot areas (which included flow Regipons and flowPara) and the two clipPaths, . . . . as suggested by {{w|Wikipedia:SVG help}} Wikipedia:SVG help on 14:18, 5 March 2020. | |
| 05:51, 5 March 2020 |  | 3,000 × 2,000 (38 KB) | RCraig09 (talk | contribs) | VERSION EIGHT: Used "Text...Convert to text" on all text elements in Inkscape. . . . Removed some hidden "Flow elements" that had been invisible. . . . Tabbed my way through each element looking for remaining flow elements and found none. | |
| 05:13, 4 March 2020 |  | 3,000 × 2,000 (46 KB) | RCraig09 (talk | contribs) | Version SEVEN: made all fonts "Liberation Sans, sans-serif" (per "Wikipedia:SVG help" discussion of Feb 25-27, 2020). Did "Text...Remove from path" and "Text... Unflow" for each text object... trying to avoid continued rendering errors. | |
| 05:47, 22 February 2020 |  | 3,000 × 2,000 (45 KB) | RCraig09 (talk | contribs) | Version Six: Trying again to solve problems rendering text on en.WP: Started all text objects from scratch this time. . . . .Reduced size of "Data:1851-2018" legend at bottom | |
| 05:51, 21 February 2020 |  | 3,000 × 2,000 (52 KB) | RCraig09 (talk | contribs) | Re-doing text to overcome weird anomalies when displayed on en.wikipedia. No change in content. | |
| 05:37, 21 February 2020 |  | 3,000 × 2,000 (52 KB) | RCraig09 (talk | contribs) | Adding "Monthly average" scale on right side. . . . . . Adding "Total hurricanes" label to left (because of addition or second scale on right) | |
| 20:12, 20 February 2020 |  | 3,000 × 2,000 (43 KB) | RCraig09 (talk | contribs) | Switch to Liberation Sans, Arial, Helvetica, sans-serif per Wikipedia:SVG help | |
| 19:16, 20 February 2020 |  | 3,000 × 2,000 (34 KB) | RCraig09 (talk | contribs) | Aligned text for months along baseline of text. I'm not sure why the image above, and in thumbnails on en.wikipedia, shows a completely different font for from the Times New Roman that's in the original SVG, and displaced the "Hurricanes making landfall in U.S." to a wrong location in some views. I'm working on it. | |
| 18:27, 20 February 2020 |  | 3,000 × 2,000 (34 KB) | RCraig09 (talk | contribs) | User created page with UploadWizard |
You cannot overwrite this file.
File usage on Commons
The following 3 pages use this file:
File usage on other wikis
The following other wikis use this file:
- Usage on en.wikipedia.org