File:ZetaM20P10R300.png
Jump to navigation
Jump to search

Size of this preview: 424 × 600 pixels. Other resolutions: 169 × 240 pixels | 339 × 480 pixels | 543 × 768 pixels | 724 × 1,024 pixels | 2,314 × 3,274 pixels.
Original file (2,314 × 3,274 pixels, file size: 77 KB, MIME type: image/png)
Captions
Captions
Add a one-line explanation of what this file represents
Summary
[edit]
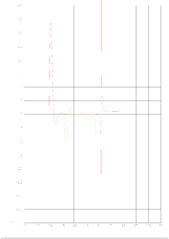
| Description | Graph of w:Riemann zeta function between -20 and +10 (red curve). The green curve between -13 and -1 is the graph of 100*zeta (x). High resolution (2,314 × 3,274). |
| Date | |
| Source | Own work |
| Author | brf |
| Permission (Reusing this file) |
no Copyright because of own work |
| I, the copyright holder of this work, release this work into the public domain. This applies worldwide. In some countries this may not be legally possible; if so: I grant anyone the right to use this work for any purpose, without any conditions, unless such conditions are required by law. |
see also
[edit]


Licensing
[edit]
I, the copyright holder of this work, hereby publish it under the following licenses:

|
Permission is granted to copy, distribute and/or modify this document under the terms of the GNU Free Documentation License, Version 1.2 or any later version published by the Free Software Foundation; with no Invariant Sections, no Front-Cover Texts, and no Back-Cover Texts. A copy of the license is included in the section entitled GNU Free Documentation License. |
| This file is licensed under the Creative Commons Attribution-Share Alike 3.0 Unported license. | ||
| ||
| This licensing tag was added to this file as part of the GFDL licensing update. |
This file is licensed under the Creative Commons Attribution-Share Alike 2.5 Generic, 2.0 Generic and 1.0 Generic license.
- You are free:
- to share – to copy, distribute and transmit the work
- to remix – to adapt the work
- Under the following conditions:
- attribution – You must give appropriate credit, provide a link to the license, and indicate if changes were made. You may do so in any reasonable manner, but not in any way that suggests the licensor endorses you or your use.
- share alike – If you remix, transform, or build upon the material, you must distribute your contributions under the same or compatible license as the original.
You may select the license of your choice.
| I, the copyright holder of this work, release this work into the public domain. This applies worldwide. In some countries this may not be legally possible; if so: I grant anyone the right to use this work for any purpose, without any conditions, unless such conditions are required by law. |
File history
Click on a date/time to view the file as it appeared at that time.
| Date/Time | Thumbnail | Dimensions | User | Comment | |
|---|---|---|---|---|---|
| current | 09:17, 5 September 2006 | | 2,314 × 3,274 (77 KB) | Brf (talk | contribs) | == Summary == == Summary == {{Information| |Graph of Riemanns zeta-function between -20 and +10 (red curve). The green curve between -13 and -1 is the graph of 100*zeta (x). |Source=own work |Date=8/30/2006 |Author=brf |Permission = no Copyright because o |
You cannot overwrite this file.
File usage on Commons
The following page uses this file: