File:VolatilityDJIA-scaled.jpg
Jump to navigation
Jump to search

Size of this preview: 800 × 534 pixels. Other resolutions: 320 × 214 pixels | 640 × 427 pixels | 1,024 × 684 pixels | 1,280 × 854 pixels | 1,600 × 1,068 pixels.
Original file (1,600 × 1,068 pixels, file size: 855 KB, MIME type: image/jpeg)
Captions
Captions
Add a one-line explanation of what this file represents


Summary
[edit]
| Description |
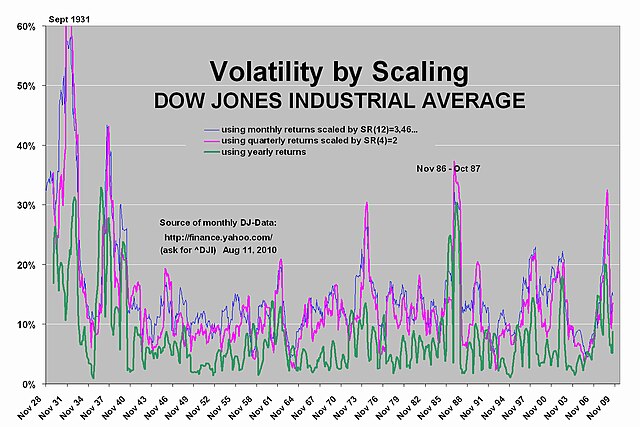
English: Show volatility of the Dow Jones Industrial Average Index since 1928, impact of the 30th, of 1987.
Proof that volatility can be and often is volatile itself. Computation: Standard deviation of monthly and quarterly returns scaled by square root of 12 or of 4 respectively. Standard deviation of yearly returns unscaled. Show that volatility scaling doesn't work for the Dow Jones Industrial Average Index from 1928 until 2010. Scaling by square root of 250 of daily returns may even lead to more errors presumably. |
| Date | |
| Source | Own work |
| Author | Gaschroeder |
Licensing
[edit]
| I, the copyright holder of this work, release this work into the public domain. This applies worldwide. In some countries this may not be legally possible; if so: I grant anyone the right to use this work for any purpose, without any conditions, unless such conditions are required by law. |
File history
Click on a date/time to view the file as it appeared at that time.
| Date/Time | Thumbnail | Dimensions | User | Comment | |
|---|---|---|---|---|---|
| current | 20:30, 12 August 2010 | | 1,600 × 1,068 (855 KB) | Gaschroeder (talk | contribs) | better resolution |
| 16:04, 11 August 2010 |  | 1,518 × 882 (179 KB) | Gaschroeder (talk | contribs) | {{Information |Description={{en|1=Show volatility of the Dow Jones Industrial Average Index since 1928, impact of the 30th, of 1987. Proof that volatility can be and often is volatile itself. Computation: Standard deviation of monthly and quarterly return |
You cannot overwrite this file.
File usage on Commons
There are no pages that use this file.
File usage on other wikis
The following other wikis use this file:
- Usage on de.wikipedia.org
- Usage on es.wikipedia.org