File:VFPt cylinder magnet potential+contour.svg
Jump to navigation
Jump to search

Size of this PNG preview of this SVG file: 600 × 600 pixels. Other resolutions: 240 × 240 pixels | 480 × 480 pixels | 768 × 768 pixels | 1,024 × 1,024 pixels | 2,048 × 2,048 pixels.
Original file (SVG file, nominally 800 × 800 pixels, file size: 196 KB)
Captions
Captions
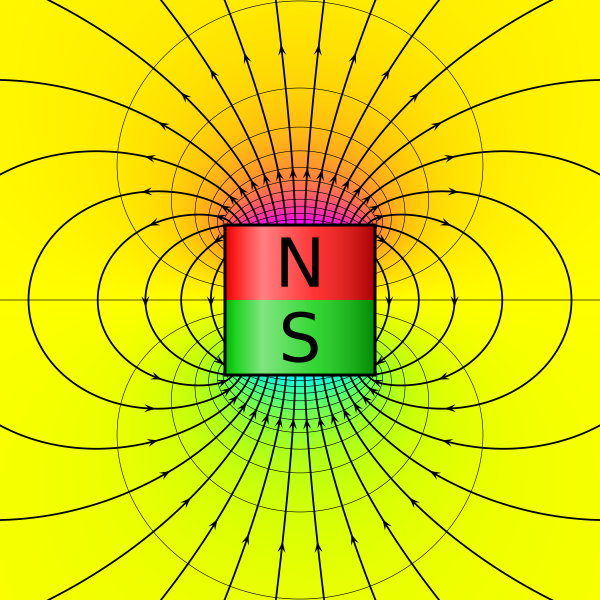
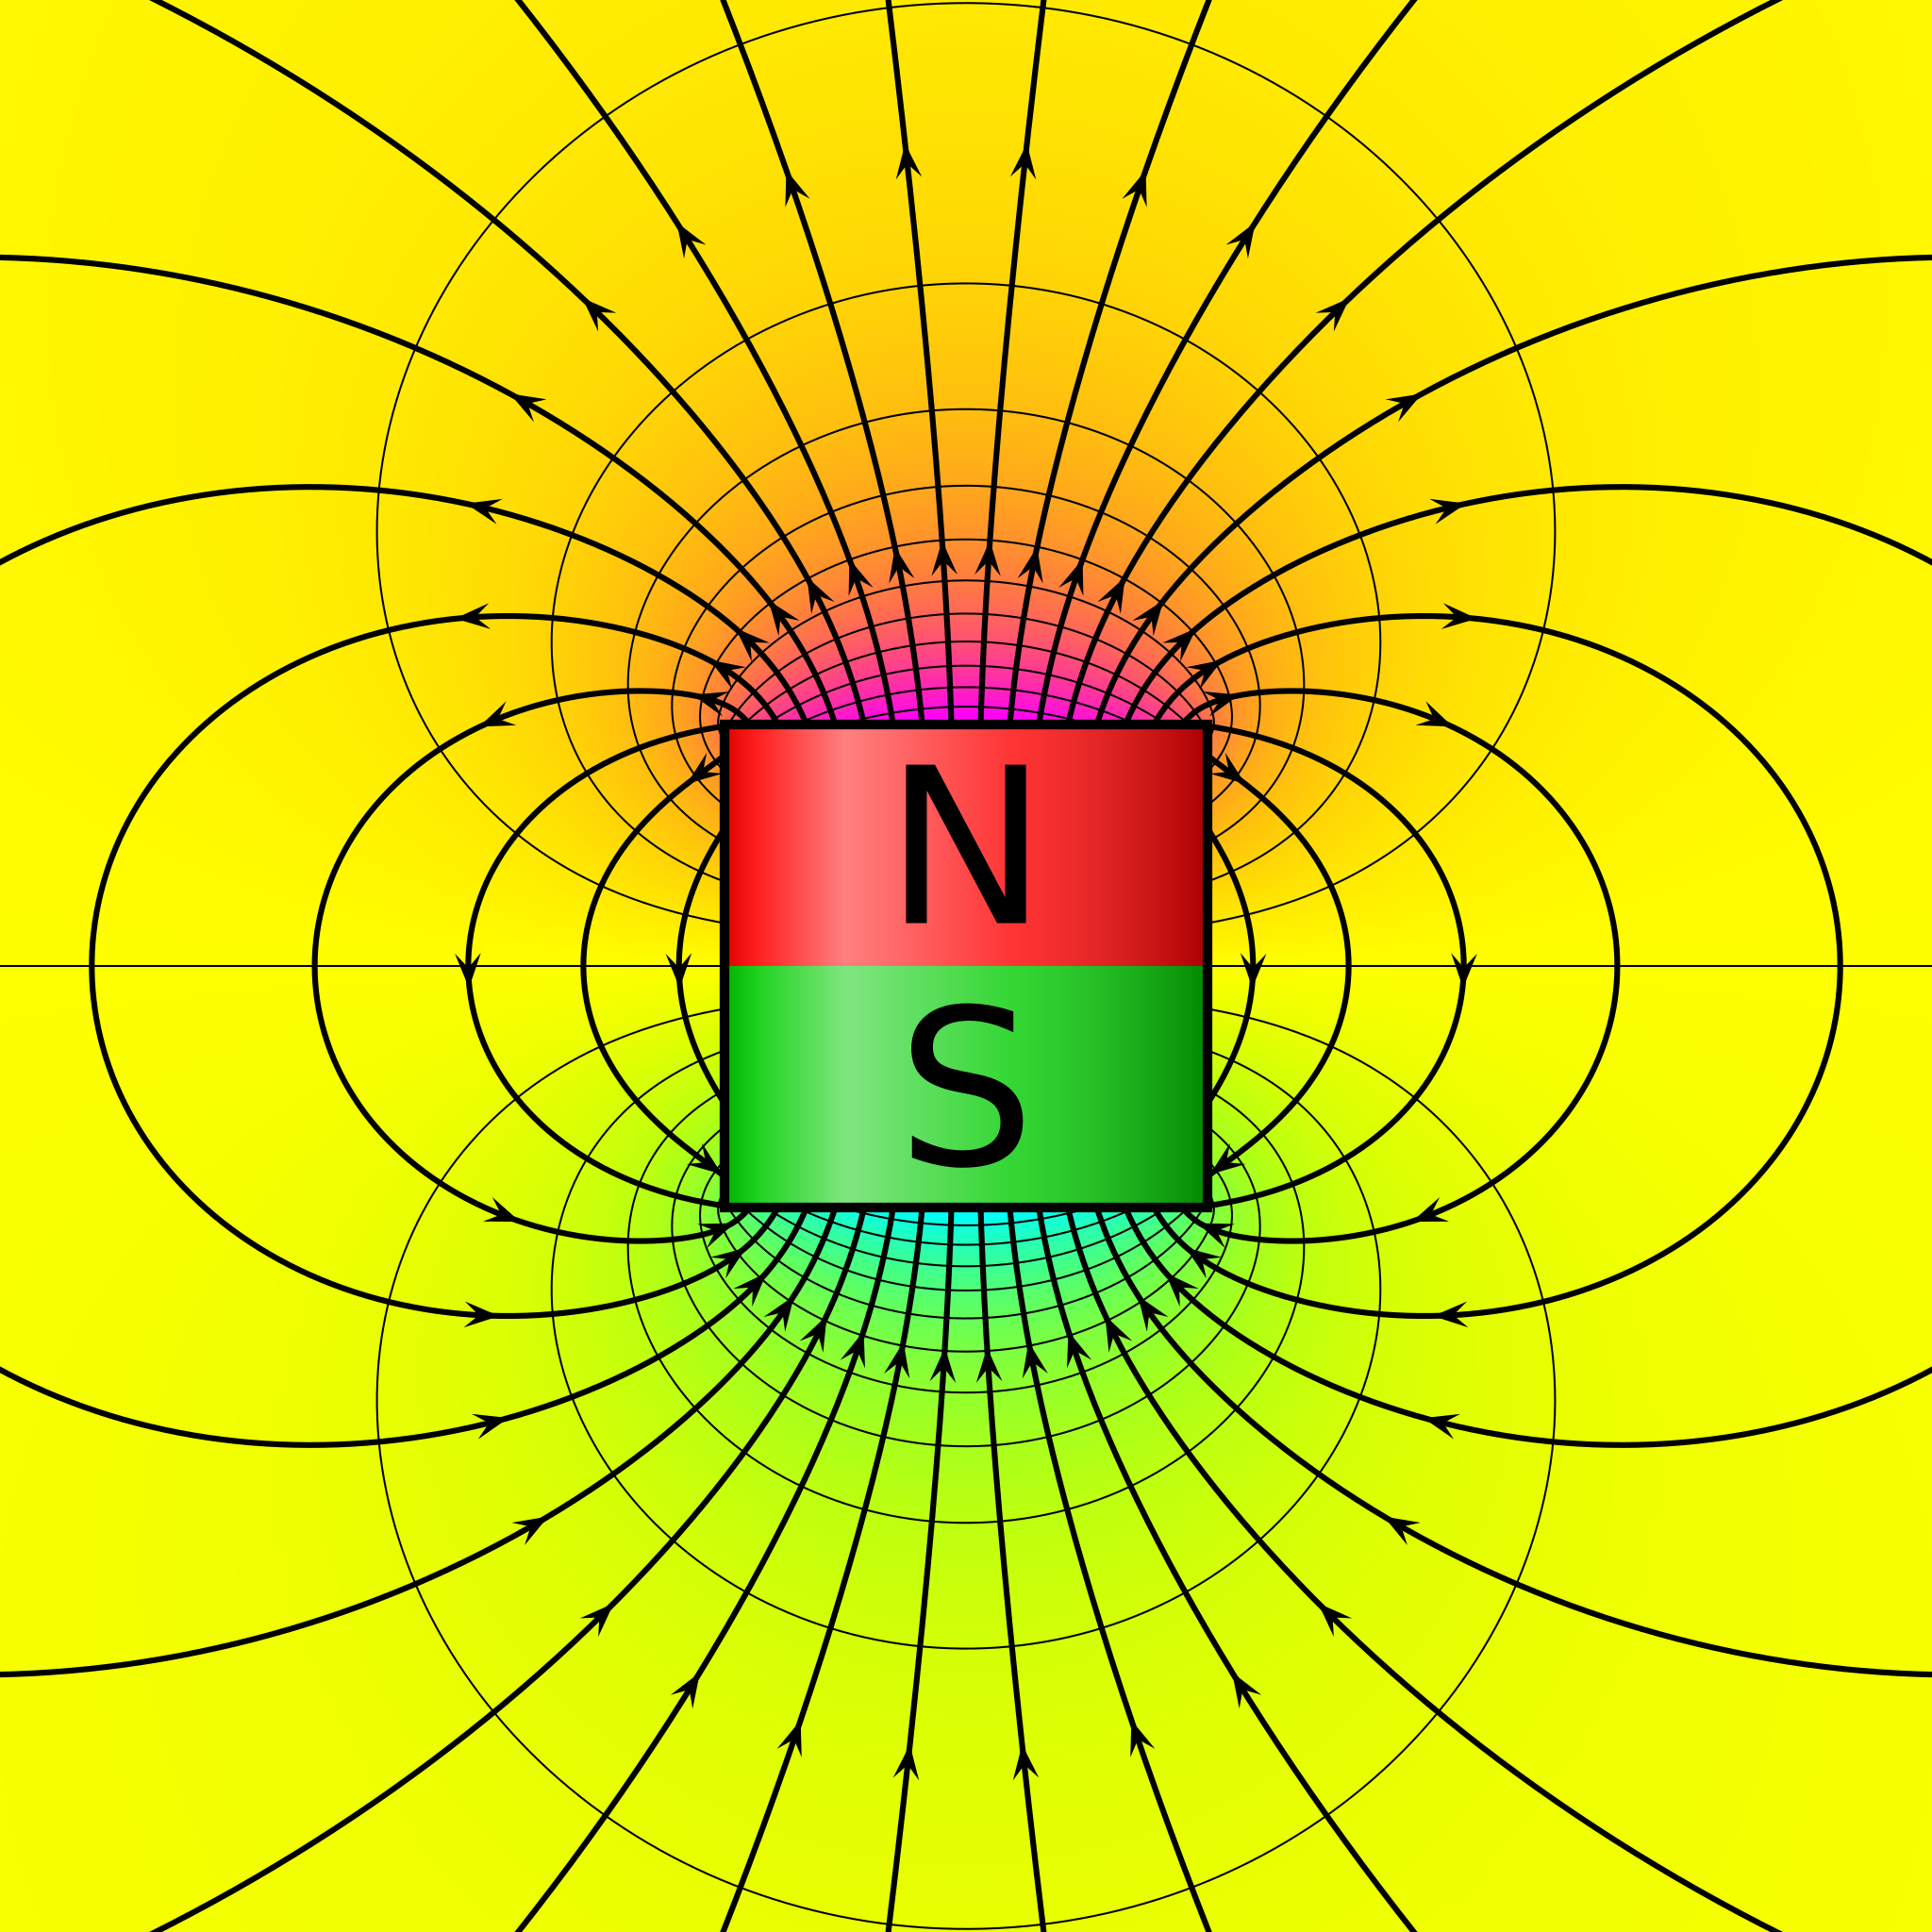
Magnetic scalar potential of a cylinder magnet
Summary
[edit]
| Description |
English: Drawing of a homogeneously magnetized cylindrical magnet with exactly computed magnetic field lines. The cylinder has the proportions R/L=1/2. The magnetic north pole is aligned on top and the magnetic south pole on the bottom, with magnetization along the cylinder axis. The magnetic scalar potential 𝜓 is shown in the background from positive (fuchsia) through zero (yellow) to negative (aqua) together with uniformely spaced equipotential lines. Note that the field lines follow the gradient of the scalar potential. |
| Date | |
| Source | Own work |
| Author | Geek3 |
| Other versions | VFPt flat cylinder magnet potential+contour.svg |
| SVG development | This plot was created with VectorFieldPlot. |
| Source code | Python code# paste this code at the end of VectorFieldPlot 3.4
# https://commons.wikimedia.org/wiki/User:Geek3/VectorFieldPlot
doc = FieldplotDocument('VFPt_cylinder_magnet_potential+contour',
commons=True, width=800, height=800)
R, L2 = 1., 1.
Bfield = Field([ ['coil', {'x': 0, 'y': 0, 'phi': pi/2, 'R': R, 'Lhalf': L2, 'I': 1}] ])
Hfield = Field([ ['charged_disc', {'x0':-R, 'y0':-L2, 'x1':R, 'y1':-L2, 'Q':-1}],
['charged_disc', {'x0':-R, 'y0':L2, 'x1':R, 'y1':L2, 'Q':1}] ])
doc.draw_magnets(Bfield)
U0 = Hfield.V([0., L2 + 0.02])
doc.draw_scalar_field(func=Hfield.V, cmap=doc.cmap_AqYlFs, vmin=-U0, vmax=U0)
U1 = Hfield.V([0., L2])
doc.draw_contours(func=Hfield.V, levels=np.linspace(-U1, U1, 25)[1:-1])
nlines = 22
startpoints = Startpath(Bfield, lambda t: np.array([-R + 2. * R * t, 0.])
).npoints(nlines)
cond = lambda xy: fabs(xy[1]) < 1e-2 or fabs(xy[1]) > L2
for iline, p0 in enumerate(startpoints):
line = FieldLine(Bfield, p0, directions='both', maxr=12)
arrows_style = {'dist':2.0}
if iline >= 3 and iline < nlines - 3:
arrows_style = {'potential':Hfield.V,
'at_potentials':[-0.46*U1, -0.12*U1, 0.12*U1, 0.46*U1],
'condition_func':cond}
doc.draw_line(line, linewidth=2.4, arrows_style=arrows_style)
doc.write()
|
Licensing
[edit]
I, the copyright holder of this work, hereby publish it under the following license:
This file is licensed under the Creative Commons Attribution 4.0 International license.
- You are free:
- to share – to copy, distribute and transmit the work
- to remix – to adapt the work
- Under the following conditions:
- attribution – You must give appropriate credit, provide a link to the license, and indicate if changes were made. You may do so in any reasonable manner, but not in any way that suggests the licensor endorses you or your use.
File history
Click on a date/time to view the file as it appeared at that time.
| Date/Time | Thumbnail | Dimensions | User | Comment | |
|---|---|---|---|---|---|
| current | 14:47, 20 June 2024 | | 800 × 800 (196 KB) | Geek3 (talk | contribs) | Uploaded own work with UploadWizard |
You cannot overwrite this file.
File usage on Commons
There are no pages that use this file.