File:VFPt charged-sheet potential+contour.svg
Jump to navigation
Jump to search

Size of this PNG preview of this SVG file: 800 × 600 pixels. Other resolutions: 320 × 240 pixels | 640 × 480 pixels | 1,024 × 768 pixels | 1,280 × 960 pixels | 2,560 × 1,920 pixels.
Original file (SVG file, nominally 800 × 600 pixels, file size: 136 KB)
Captions
Captions
Add a one-line explanation of what this file represents
Summary
[edit]
| Description |
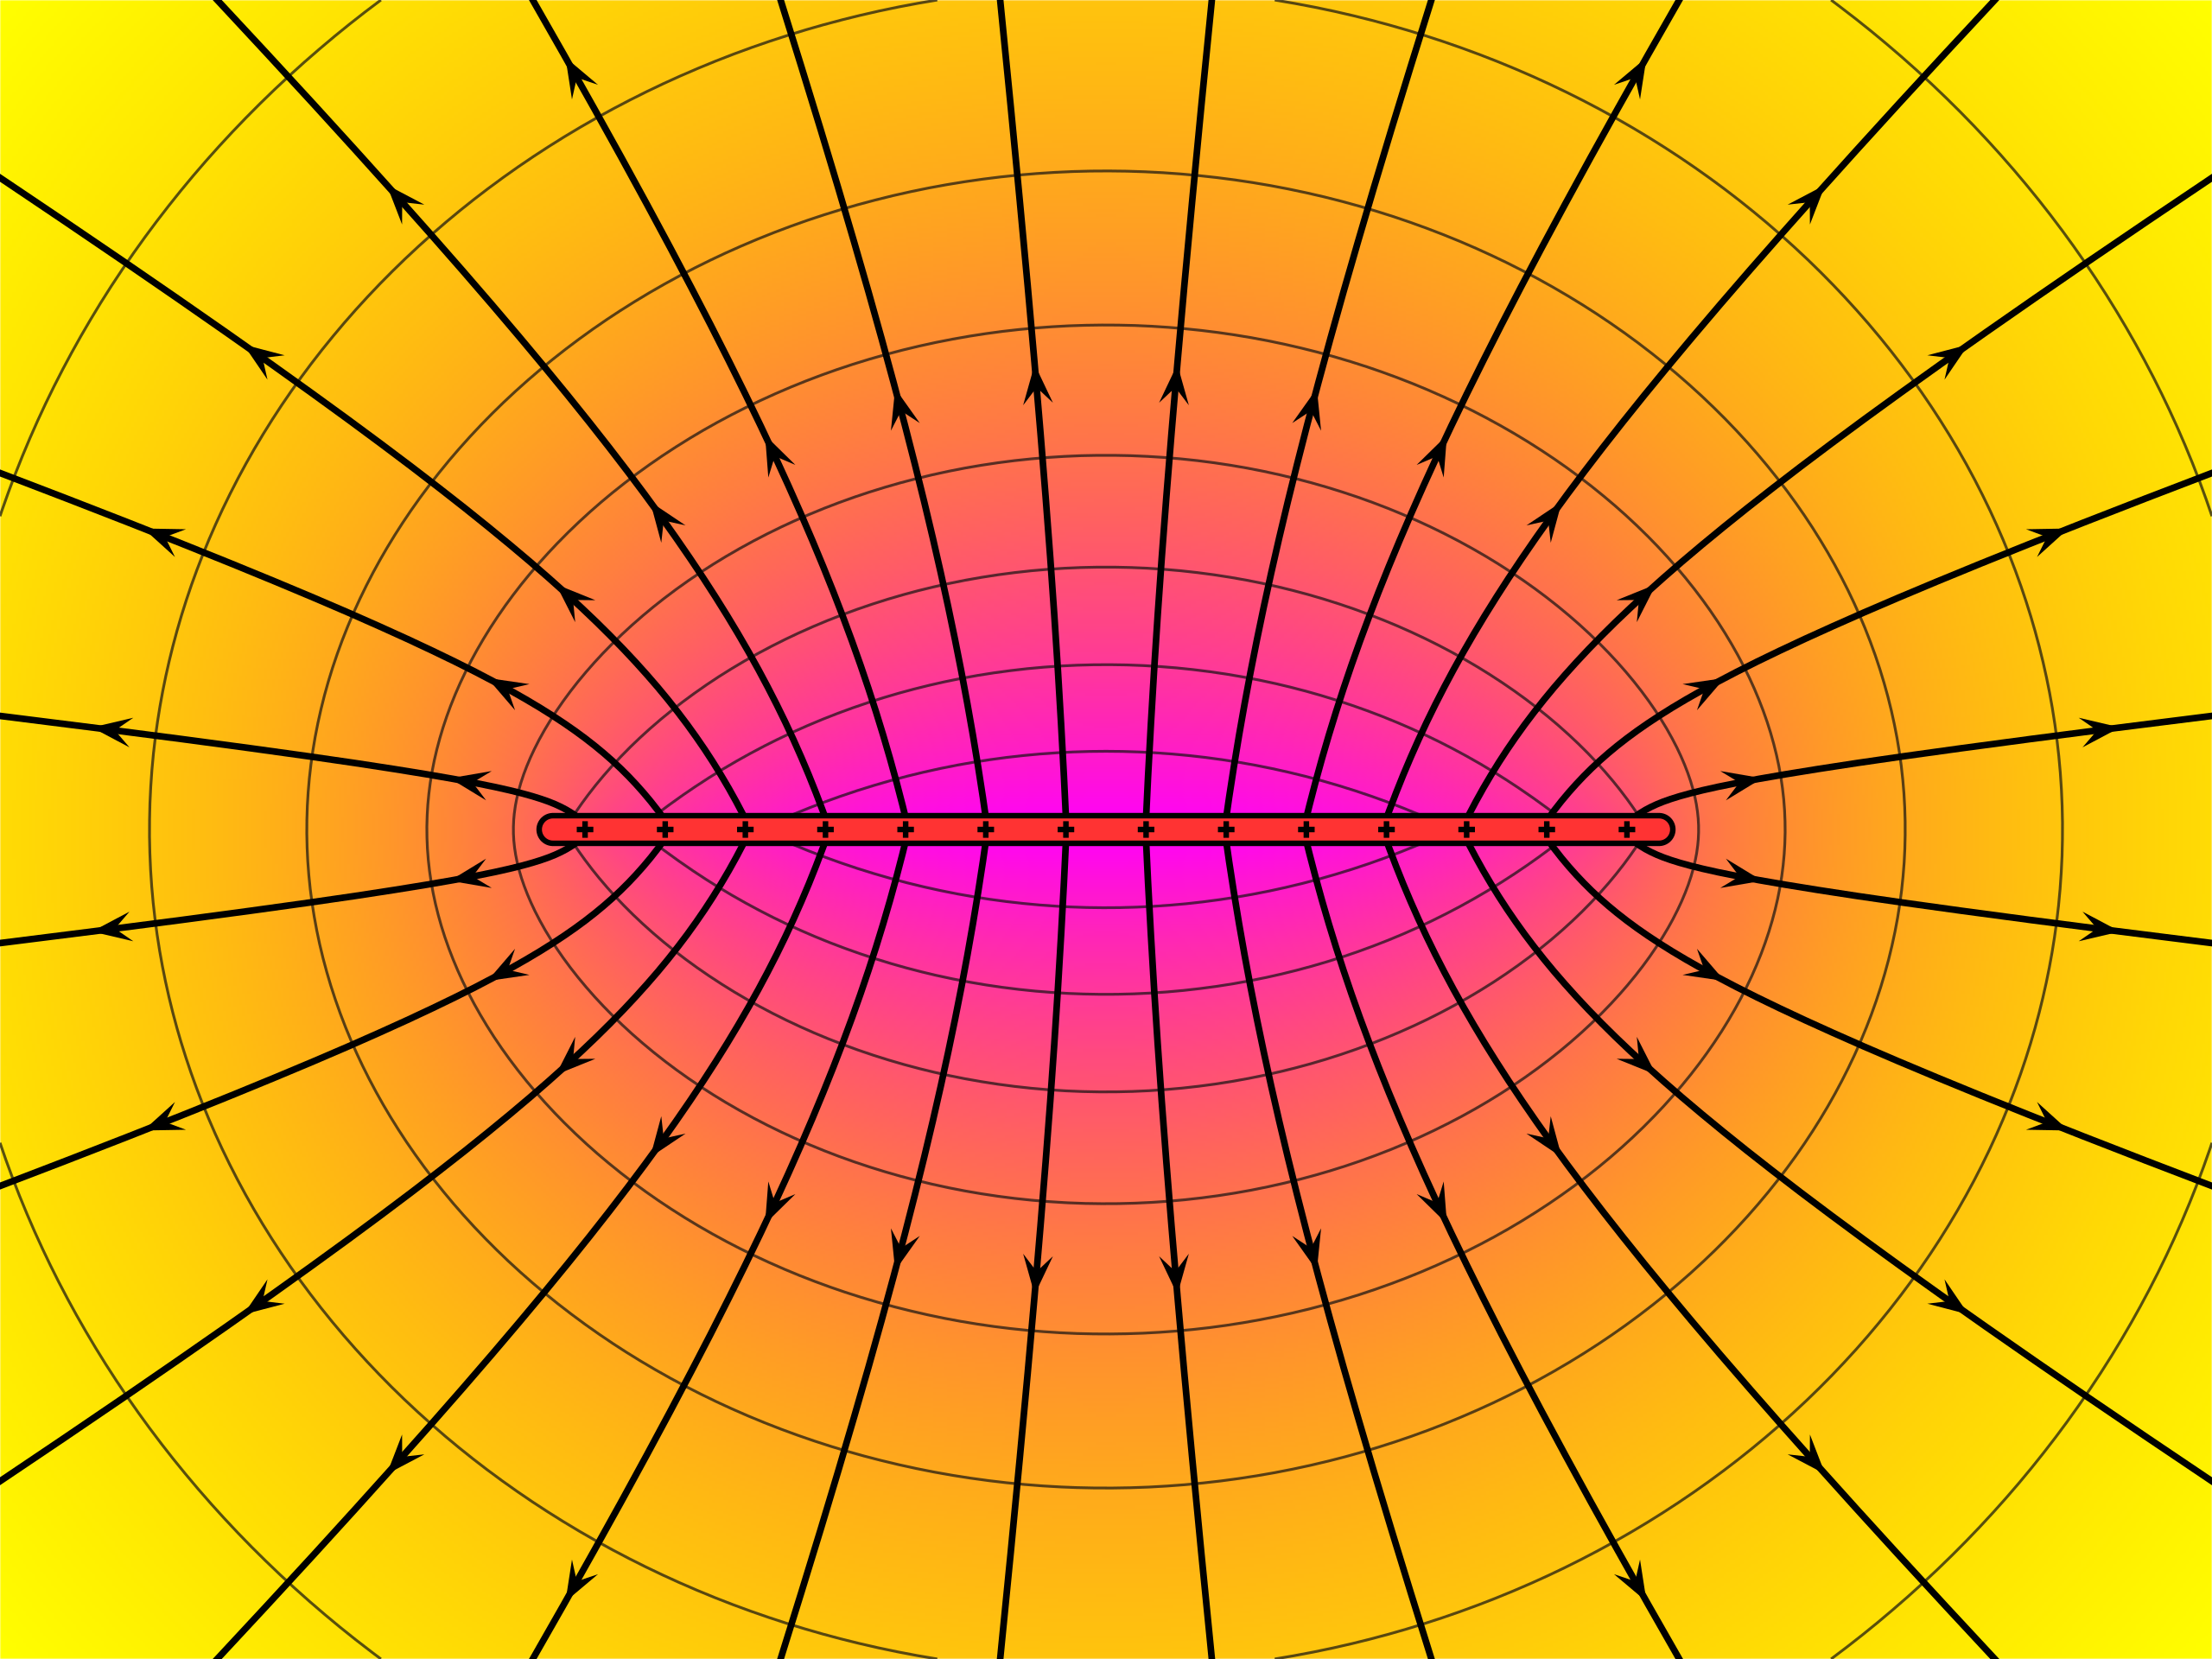
English: Electric field lines around an infinite flat uniformly electrically charged sheet. The shape of the field is computed precisely. The background color map shows the electric potential. |
| Date | |
| Source | Own work |
| Author | Geek3 |
| Other versions | VFPt charged-sheet.svg |
| SVG development | This plot was created with VectorFieldPlot. |
| Source code | Python code# paste this code at the end of VectorFieldPlot 3.2
# https://commons.wikimedia.org/wiki/User:Geek3/VectorFieldPlot
doc = FieldplotDocument('VFPt_charged-sheet_potential+contour', width=800, height=600, commons=True)
x0, y0, x1, y1 = -2, 0, 2, 0
field = Field([['charged_plane', {'x0':x0, 'y0':y0, 'x1':x1, 'y1':y1, 'q':1}]])
U0 = field.V((0,0))
U1 = field.V((4,3))
doc.draw_scalar_field(func=field.V, cmap=doc.cmap_AqYlFs, vmin=2*U1-U0, vmax=U0)
doc.draw_contours(func=field.V, linewidth=1, linecolor='#111111',
levels=sc.linspace(U1, U0, 10)[1:-1], attributes={'opacity':'0.7'})
startpath = Startpath(field, lambda t: array((3*sin(2*pi*t), 1.5*cos(2*pi*t))))
nlines = 28
for iline in range(nlines):
p0 = startpath.startpos((iline + 0.5) / nlines)
line = FieldLine(field, p0, directions='both', maxr=5)
doc.draw_line(line, linewidth=2.4, arrows_style={'potential':field.V, 'at_potentials':[field.V((2.3, 0)), field.V((3.6, 0))]})
g = doc.draw_object('g', {'id':'sheet',
'style':'fill:none; stroke:#000; stroke-width:0.02; stroke-linecap:square'})
points = '{},{} {},{}'.format(x0, y0, x1, y1)
doc.draw_object('polyline', {'stroke':'#000000', 'stroke-width':0.12,
'points':points, 'stroke-linecap':'round'}, group=g)
doc.draw_object('polyline', {'stroke':'#ff3333', 'stroke-width':0.08,
'points':points, 'stroke-linecap':'round'}, group=g)
nsign = nlines // 2
plus = 'M 0,-0.02 v 0.04 M -0.02,0 h 0.04'
M = 0.5 * (array([x0, y0]) + array([x1, y1]))
R = array([x1, y1]) - M
for i in range(nsign):
pos = M + R * (2 * (i + 0.4) / (nsign-0.2) - 1)
doc.draw_object('path', {'d':plus,
'transform':'translate({:.6g},{:.6g})'.format(*pos)}, group=g)
doc.write()
|
Licensing
[edit]
I, the copyright holder of this work, hereby publish it under the following license:
This file is licensed under the Creative Commons Attribution-Share Alike 4.0 International license.
- You are free:
- to share – to copy, distribute and transmit the work
- to remix – to adapt the work
- Under the following conditions:
- attribution – You must give appropriate credit, provide a link to the license, and indicate if changes were made. You may do so in any reasonable manner, but not in any way that suggests the licensor endorses you or your use.
- share alike – If you remix, transform, or build upon the material, you must distribute your contributions under the same or compatible license as the original.
File history
Click on a date/time to view the file as it appeared at that time.
| Date/Time | Thumbnail | Dimensions | User | Comment | |
|---|---|---|---|---|---|
| current | 12:12, 11 November 2020 | | 800 × 600 (136 KB) | Geek3 (talk | contribs) | Uploaded own work with UploadWizard |
You cannot overwrite this file.
File usage on Commons
The following page uses this file: