File:US timeline. Opioid deaths (hy).png
Jump to navigation
Jump to search

Size of this preview: 799 × 599 pixels. Other resolutions: 320 × 240 pixels | 640 × 480 pixels | 1,024 × 768 pixels | 1,280 × 960 pixels | 2,702 × 2,027 pixels.
Original file (2,702 × 2,027 pixels, file size: 948 KB, MIME type: image/png)
Captions
Captions
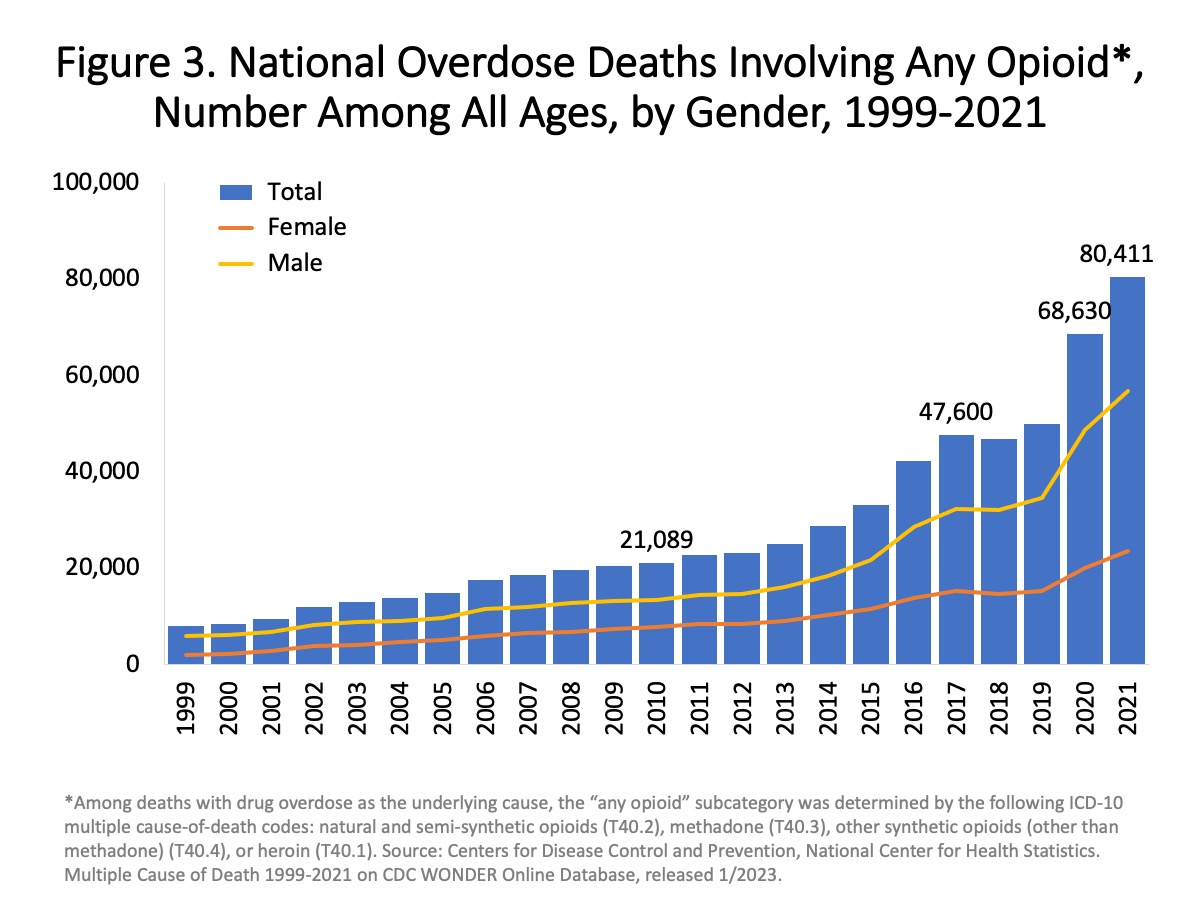
Timeline of US Overdose Deaths Involving Any Opioid—Number Among All Ages, by Gender.
Summary
[edit]| Description |
English: Timeline of US Overdose Deaths Involving Any Opioid—Number Among All Ages, by Gender.
Հայերեն: Օփիոիդներ պարունակող թմրանյութերի գերդոզավորումից մահերի ժամանակագրությունն ԱՄՆ-ում, բոլոր տարիքային խմբեր, ըստ սեռի։ |
| Date | |
| Source |
Wikimedia Commons: |
| Author | National Institute on Drug Abuse. On some versions of the chart freeware IrfanView was used to crop out the outer white space. And/or edit text at the top, and add a border. See Commons:Convert tables and charts to wiki code or image files, and the section about adding and editing text on chart images. |

.png&action=edit§ion=1)
Licensing
[edit].png&action=edit§ion=2)
This image is a work of the National Institutes of Health, part of the United States Department of Health and Human Services, taken or made as part of an employee's official duties. As a work of the U.S. federal government, the image is in the public domain.
 |
||
| This file has been identified as being free of known restrictions under copyright law, including all related and neighboring rights. | ||
File history
Click on a date/time to view the file as it appeared at that time.
| Date/Time | Thumbnail | Dimensions | User | Comment | |
|---|---|---|---|---|---|
| current | 06:42, 7 August 2024 | | 2,702 × 2,027 (948 KB) | GeoO (talk | contribs) | correction |
| 07:08, 6 August 2024 |  | 2,702 × 2,027 (948 KB) | GeoO (talk | contribs) | Uploaded a work by National Institute on Drug Abuse. On some versions of the chart freeware IrfanView was used to crop out the outer white space. And/or edit text at the top, and add a border. See Commons:Convert tables and charts to wiki code or image files, and the section about adding and editing text on chart images. from Wikimedia Commons: 250px [http://www.drugabuse.gov/related-topics/tr... |
You cannot overwrite this file.
File usage on Commons
There are no pages that use this file.
File usage on other wikis
The following other wikis use this file:
- Usage on hy.wikipedia.org
.png&oldid=915212876)