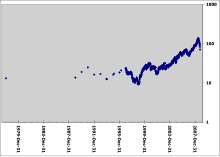
File:US oil price in dollars from 1999 to 2008-10-31.svg
From Wikimedia Commons, the free media repository
Jump to navigation
Jump to search

Size of this PNG preview of this SVG file: 774 × 527 pixels. Other resolutions: 320 × 218 pixels | 640 × 436 pixels | 1,024 × 697 pixels | 1,280 × 872 pixels | 2,560 × 1,743 pixels.
Original file (SVG file, nominally 774 × 527 pixels, file size: 52 KB)
File information
Structured data
Captions
Captions
Add a one-line explanation of what this file represents
Summary
[edit]| DescriptionUS oil price in dollars from 1999 to 2008-10-31.svg |
English: United States oil price from 1999 to 2008 October 31; weekly prices in United States dollars per barrel on the vertical scale, with year markers on the horizontal scale. |
| Date | |
| Source | I, 84user, created this work using the excel file pet_pri_wco_k_w.xls from the U.S. Energy Information Administration's web page http://tonto.eia.doe.gov/dnav/pet/pet_pri_wco_k_w.htm (direct link http://tonto.eia.doe.gov/dnav/pet/xls/pet_pri_wco_k_w.xls) and using Open Source Gnumeric 1.9.1 to produce the chart. |
| Author | 84user (talk) |
| Permission (Reusing this file) |
See "Licensing" below |
| Other versions |
English: None |
See also
[edit]


Licensing
[edit]I, the copyright holder of this work, hereby publish it under the following license:
| Public domainPublic domainfalsefalse |
| I, the copyright holder of this work, release this work into the public domain. This applies worldwide. In some countries this may not be legally possible; if so: I grant anyone the right to use this work for any purpose, without any conditions, unless such conditions are required by law. |
File history
Click on a date/time to view the file as it appeared at that time.
| Date/Time | Thumbnail | Dimensions | User | Comment | |
|---|---|---|---|---|---|
| current | 11:28, 11 November 2008 |  | 774 × 527 (52 KB) | 84user (talk | contribs) | {{Information |Description=United States oil price from 1999 to 2008 October 31; weekly prices in United States dollars per barrel on the vertical scale, with year markers on the horizontal scale. Related charts: [[Image:US oil price in dollars from 1999 |
You cannot overwrite this file.
File usage on Commons
Hidden categories: